Meme Coins Price Prediction: Dogecoin eyes breakout, Shiba Inu shows recovery signs, Pepe stabilizes
- Dogecoin price is nearing the key resistance zone on Tuesday, a close above suggests a rally ahead.
- Shiba Inu’s momentum indicators show early signs of a fading bearish trend.
- Pepe price trades at $0.0000032 on Tuesday after rebounding slightly the previous day.

Meme coins are showing early signs of stabilization as of writing on Tuesday, as the broader crypto market attempts to recover. Dogecoin (DOGE) is nearing a key resistance zone where a breakout could open the door for further upside. Shiba Inu (SHIB) shows signs of fading bearish momentum, while Pepe (PEPE) is stabilizing after a modest recovery, suggesting the market participants are cautiously returning to the meme coin sector.
Dogecoin could extend its recovery if it closes above the horizontal barrier
Dogecoin price is trading at $0.090 as of writing on Monday, after a slight recovery the previous day. The near-term bias is mildly bearish as price holds beneath the long-standing descending trendline from $0.218 and below both the 50- and 100-day Exponential Moving Averages (EMAs), which continue to slope lower and cap rebounds.
Momentum is weak rather than washed out, with the Relative Strength Index (RSI) on the daily chart hovering in the low-40s, while the Moving Average Convergence Divergence (MACD) line stays marginally above its signal and around the zero mark, reinforcing a lack of decisive buying pressure despite sporadic volume spikes.
Immediate resistance is located at the horizontal barrier near $0.091, with a daily close above there opening the way toward the 23.6% Fibonacci retracement of the $0.080–$0.127 downswing at $0.092 and then the 38.2% retracement at $0.098.
On the downside, support is implied closer to the recent lows above $0.089, where failure would expose the $0.080 area at the base of the Fibonacci range, a break of which would extend the broader downtrend.
Shiba Inu shows signs of fading bearish strength
Shiba Inu closed above the daily resistance at $0.0000054 on Monday, and as of writing on Tuesday, SHIB is extending its recovery above $0.0000055.
If SHIB continues its recovery, it could extend the gains toward the 50-day EMA at $0.0000063.
The RSI on the daily chart is 40, pointing upward toward the neutral 50 level, indicating fading bearish momentum. For the recovery rally to be sustained, the RSI must move above the neutral level. The MACD shows a bullish crossover on Tuesday, further supporting the recovery thesis.
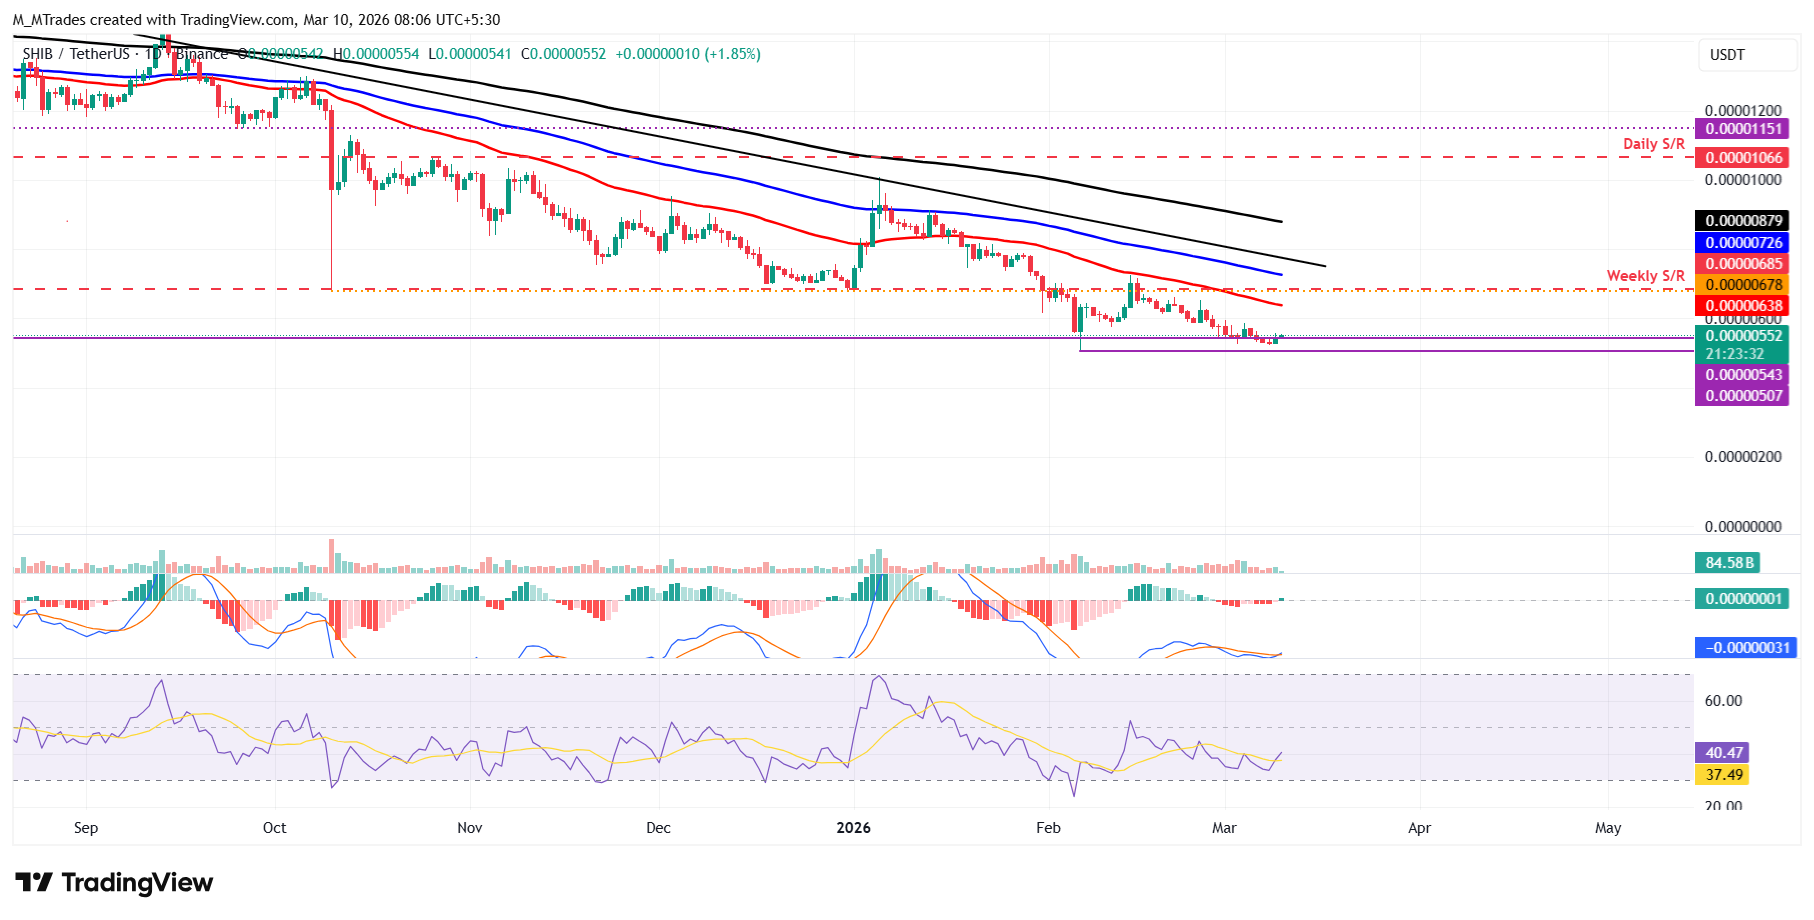
On the other hand, if SHIB corrects, it could extend the decline toward the February 6 low of $0.0000050.
Pepe rebounds after retesting key support
Pepe price retested the February 6 low of $0.0000031 on Sunday and recovered slightly the next day. As of Tuesday, PEPE is trading at $0.0000032.
If PEPE continues its recovery, it could extend the gains toward the 50-day EMA at $0.0000040.
Like SHIB, PEPE’s RSI shows fading bearish momentum, while MACD lines are converging, indicating indecision among traders.
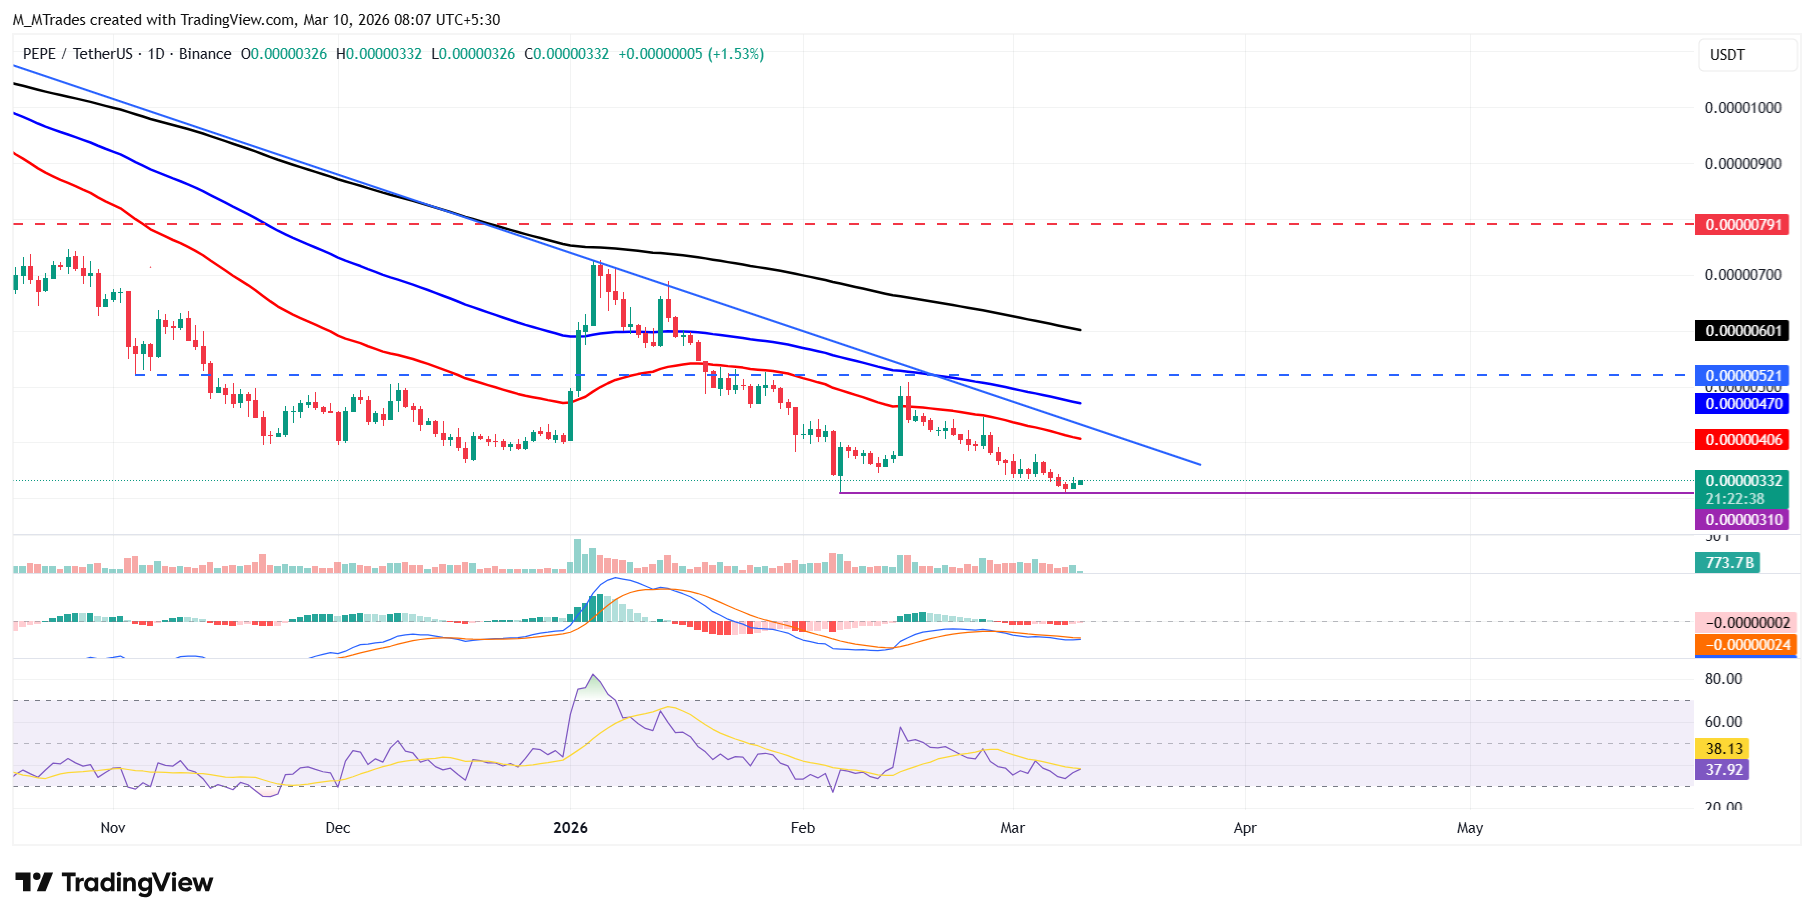
However, if PEPE faces correction, it could extend the decline toward the February 6 low at $0.0000031.
(The technical analysis of this story was written with the help of an AI tool.)
Author

Manish Chhetri
FXStreet
Manish Chhetri is a crypto specialist with over four years of experience in the cryptocurrency industry.



