XRP risks extending decline as cooling buy-side pressure weighs
- XRP extends its decline for the second consecutive day, testing the 50-day EMA support on Thursday.
- Mild inflows into XRP spot ETFs and cooling retail demand could limit recovery potential.
- XRP faces sustained downward pressure, with the 100-day and 200-day EMAs still trending lower.

Ripple (XRP) is struggling to stay above support at $1.41 as of writing on Thursday, reflecting a broader correction in the crypto market. The remittance token was rejected at its weekly high of $1.46 on Wednesday, and is currently staring at a potential pullback below the pivotal $1.40 demand zone.
XRP risks further decline amid fading institutional and retail demand
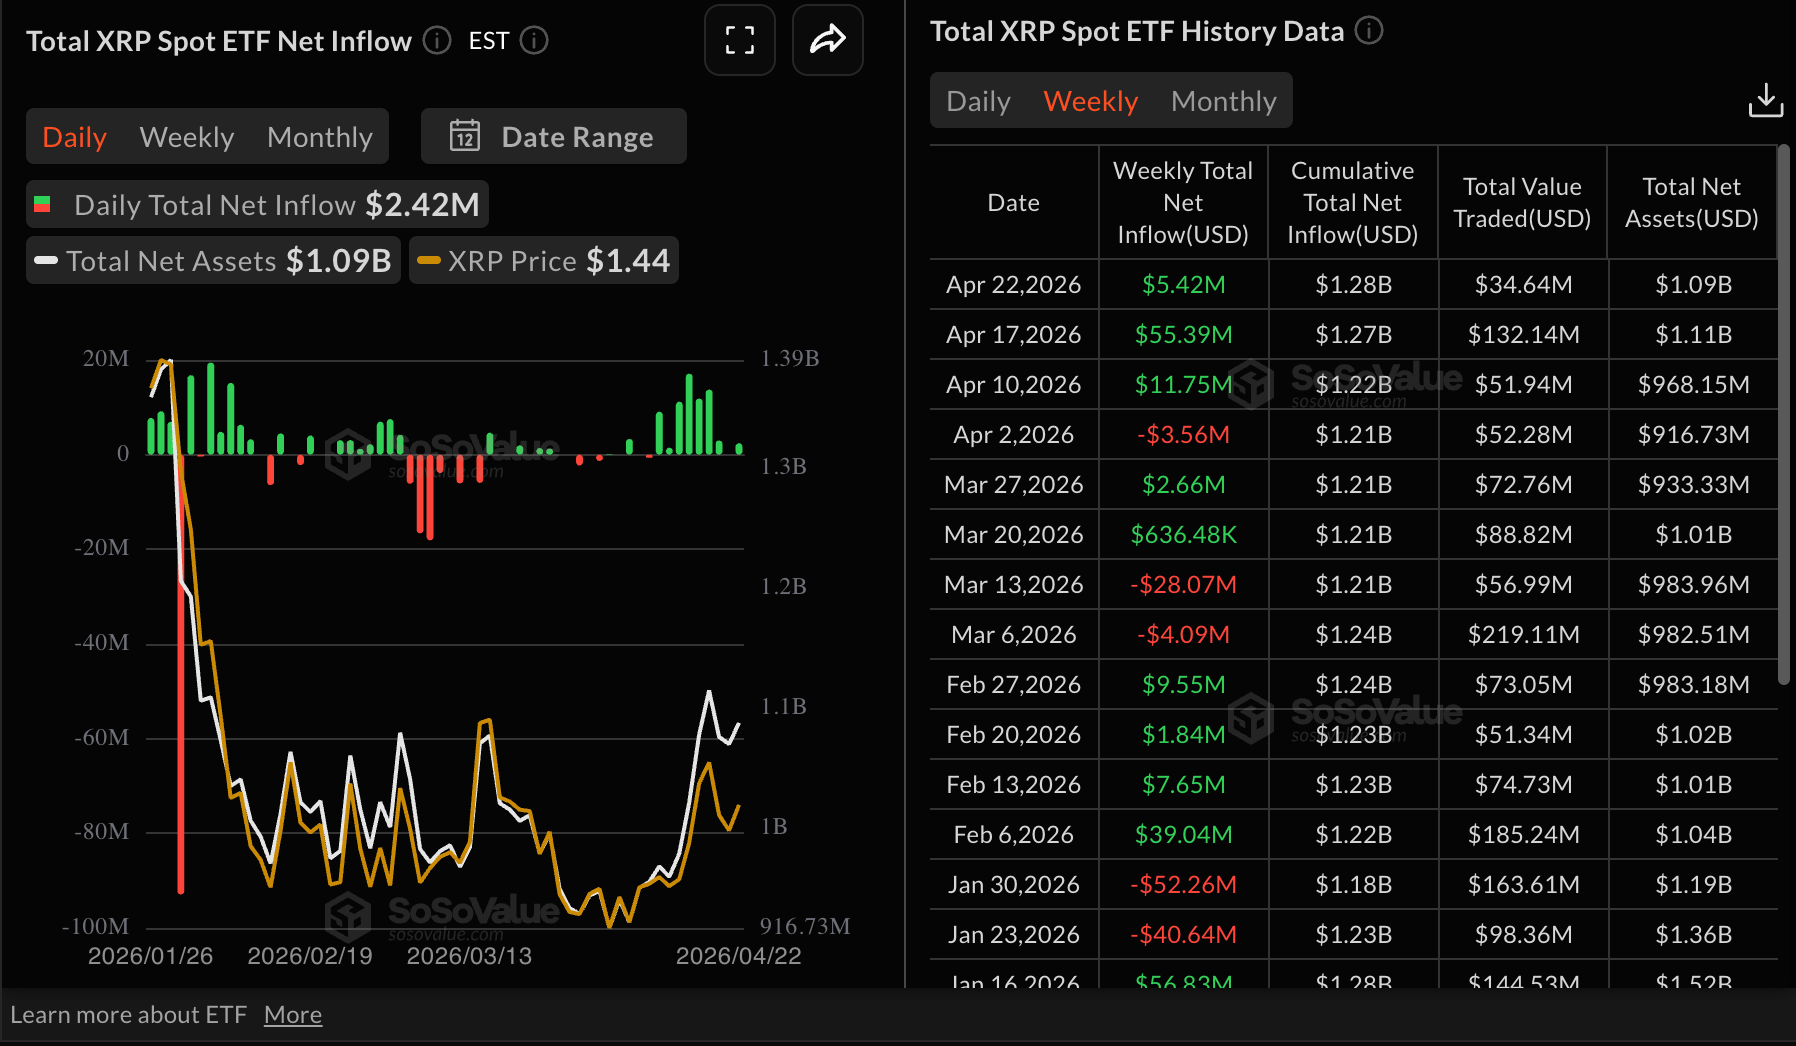
Interest in XRP spot Exchange-Traded Funds (ETFs) appears to be fading this week, with roughly $5.42 million in inflows recorded through Wednesday, compared with $55.39 million the previous week.
Inflows totaled $2.42 million on Wednesday, following muted activity the previous day. Meanwhile, cumulative inflows average $1.28 billion and total net assets $1.09 billion, according to SoSoValue data. Steady institutional demand is required to help shape sentiment and sustain XRP’s recovery.
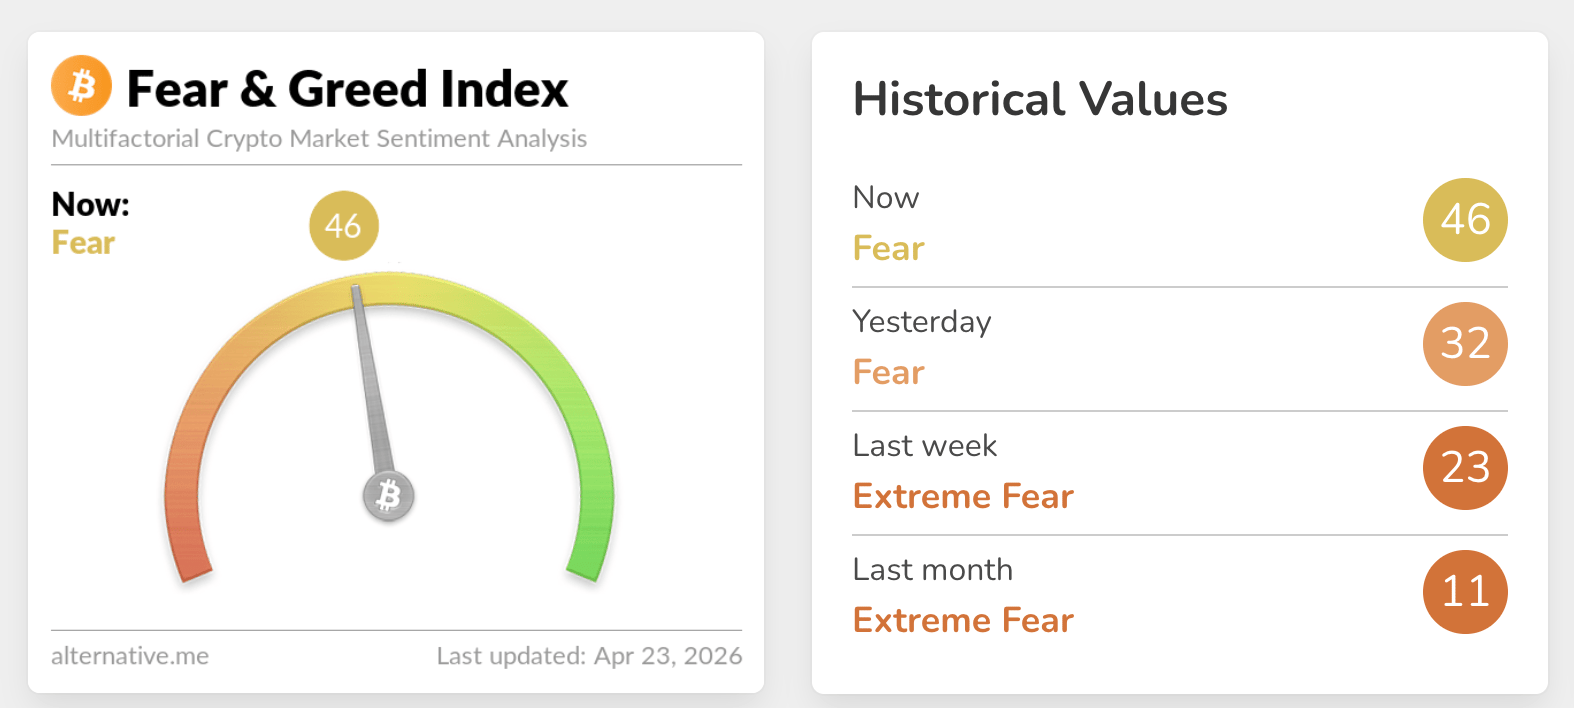
The XRP derivatives market has not shown signs of a significant turnaround despite sentiment improving to 46 in the fear territory on Thursday, up from 32 the previous day, according to the crypto Fear & Greed Index. Higher sentiment readings suggest an increasing appetite for crypto assets.
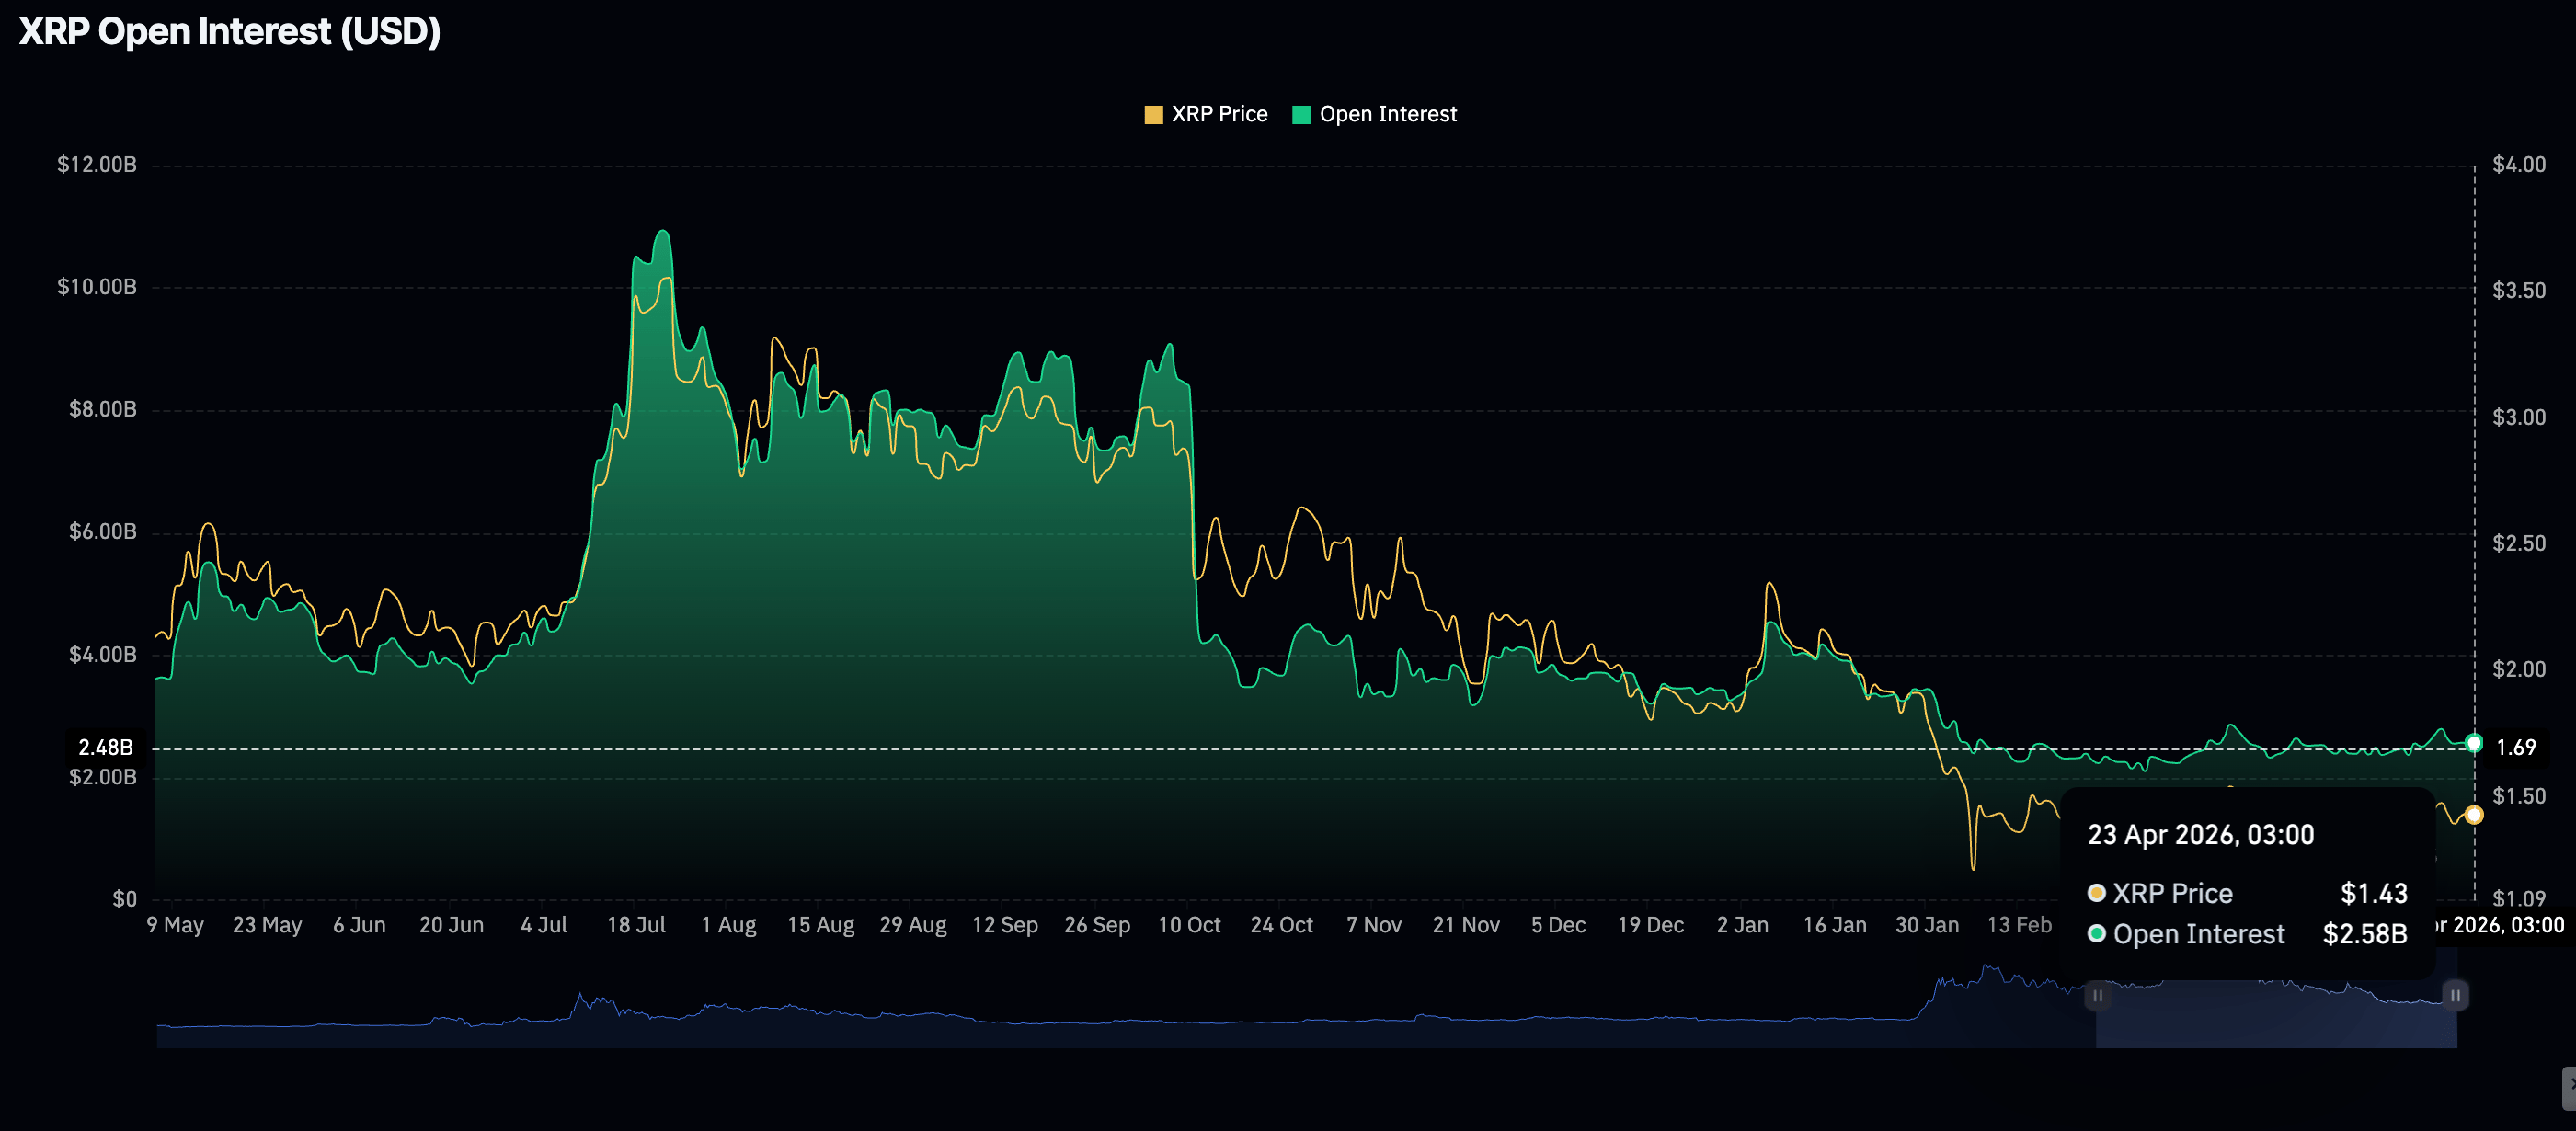
However, retail demand has remained relatively low, with futures Open Interest (OI) steadying at $2.58 billion on Thursday. CoinGlass data shows that OI peaked at $10.94 billion in July, coinciding with XRP hitting a new record high of $3.66. This underscores the positive impact of persistently rising retail demand on the bullish outlook.
Technical outlook: XRP tests baseline support as overhead pressure weighs
XRP trades at $1.41, maintaining a capped tone as it sits beneath all the major Exponential Moving Averages (EMAs). The 50-day EMA at $1.41 hovers just overhead as immediate dynamic resistance, with the 100-day EMA at $1.54 and the 200-day EMA at $1.78 reinforcing a broader bearish structure.
A long-standing downward resistance trendline remains unchallenged, with its projected break level at $1.67 still well above the market price. Momentum readings send mixed signals, as the Moving Average Convergence Divergence (MACD) histogram is slightly positive on the daily chart, while the Relative Strength Index (RSI) is around 53, showcasing a neutral tone. The Money Flow Index (MFI) near 79 hints at overbought conditions and the risk of renewed selling from higher levels.
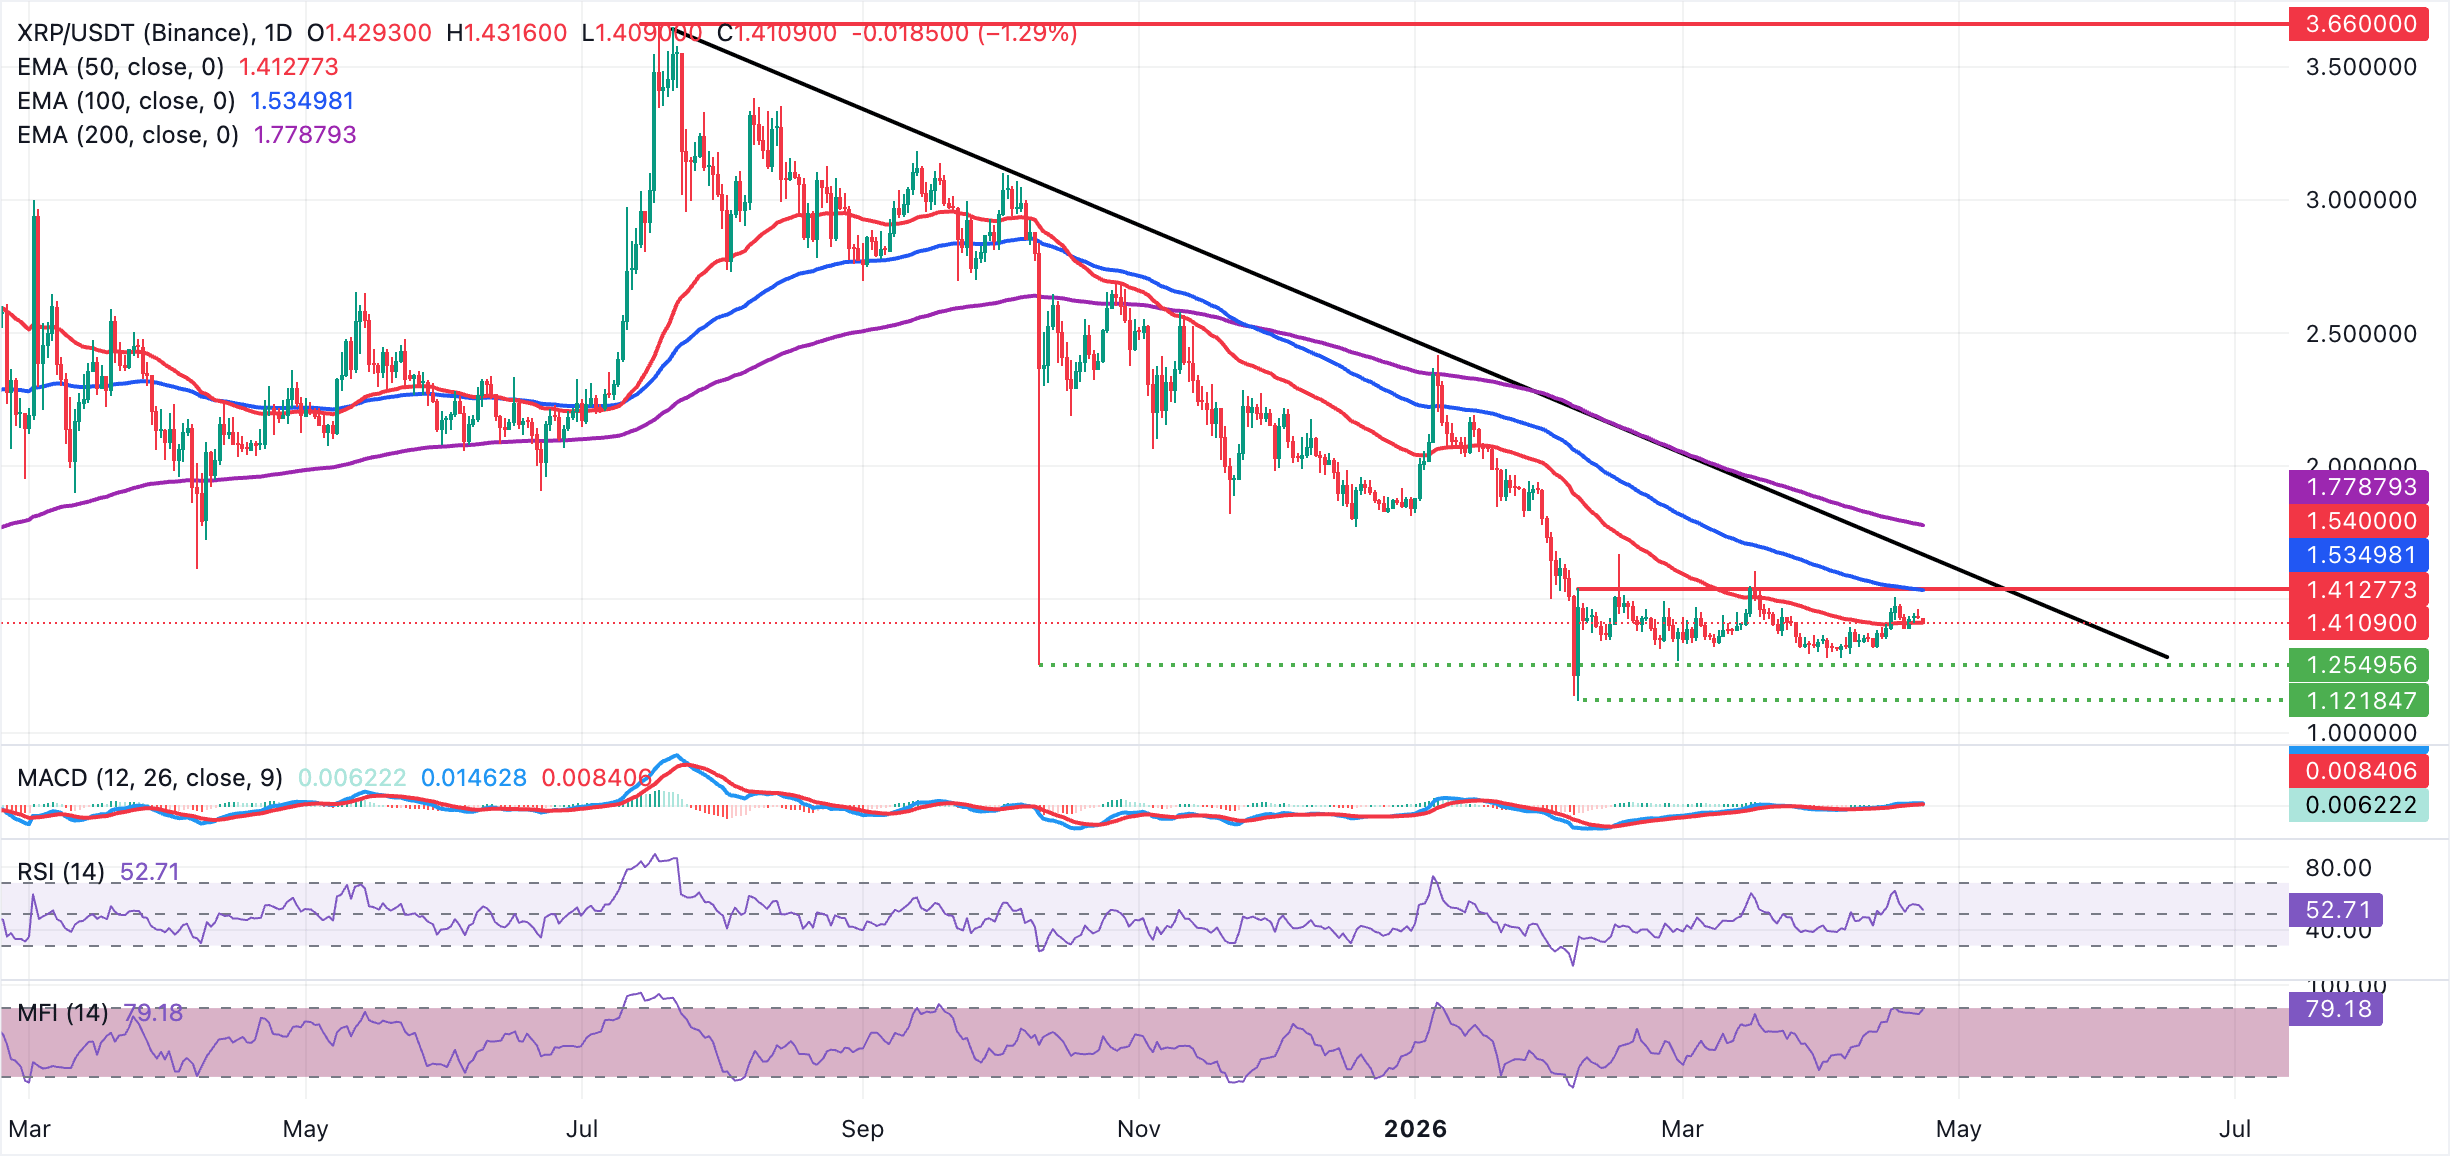
On the topside, initial resistance is defined by the daily open at $1.43. A sustained close above this barrier would be needed to ease immediate downside pressure. Further up, the 100-day EMA at $1.54 acts as the next obstacle, ahead of the descending trendline break level near $1.67, with the 200-day EMA at $1.78 capping the broader recovery outlook.
On the downside, the pivotal $1.40 demand zone serves as the initial support if XRP extends its decline below the 50-day EMA at $1.41. The weekly open at $1.39 reinforces the above support, but a decisive break here could see XRP slide back toward lower levels, consistent with the overall bearish structure.
(The technical analysis of this story was written with the help of an AI tool.)
Open Interest, funding rate FAQs
Higher Open Interest is associated with higher liquidity and new capital inflow to the market. This is considered the equivalent of increase in efficiency and the ongoing trend continues. When Open Interest decreases, it is considered a sign of liquidation in the market, investors are leaving and the overall demand for an asset is on a decline, fueling a bearish sentiment among investors.
Funding fees bridge the difference between spot prices and prices of futures contracts of an asset by increasing liquidation risks faced by traders. A consistently high and positive funding rate implies there is a bullish sentiment among market participants and there is an expectation of a price hike. A consistently negative funding rate for an asset implies a bearish sentiment, indicating that traders expect the cryptocurrency’s price to fall and a bearish trend reversal is likely to occur.
Author

John Isige
FXStreet
John Isige is a seasoned cryptocurrency journalist and markets analyst committed to delivering high-quality, actionable insights tailored to traders, investors, and crypto enthusiasts. He enjoys deep dives into emerging Web3 tren


