XRP bulls target breakout above 100-day EMA
- XRP bulls tighten their grip on $1.45 resistance, aiming for a 6% increase to reclaim the 100-day EMA.
- XRP builds breakout momentum as long bets rise, with Open Interest-Weighted Funding Rate at 0.0066% on Wednesday.
- Momentum indicators remain bullish, with the RSI above the midline and the MACD holding a buy signal.

Ripple (XRP) is gaining traction, pressing into short-term resistance at $1.45 at the time of writing on Wednesday, as sentiment across the crypto market broadly steadies amid the extension of the United States (US)-Iran ceasefire.
Despite neither country having committed to a second round of peace talks, the ceasefire appears to be containing volatility in global markets. Since the ceasefire came into effect on April 8, XRP has increased by 8.5%, underscoring the importance of peace in the Middle East.
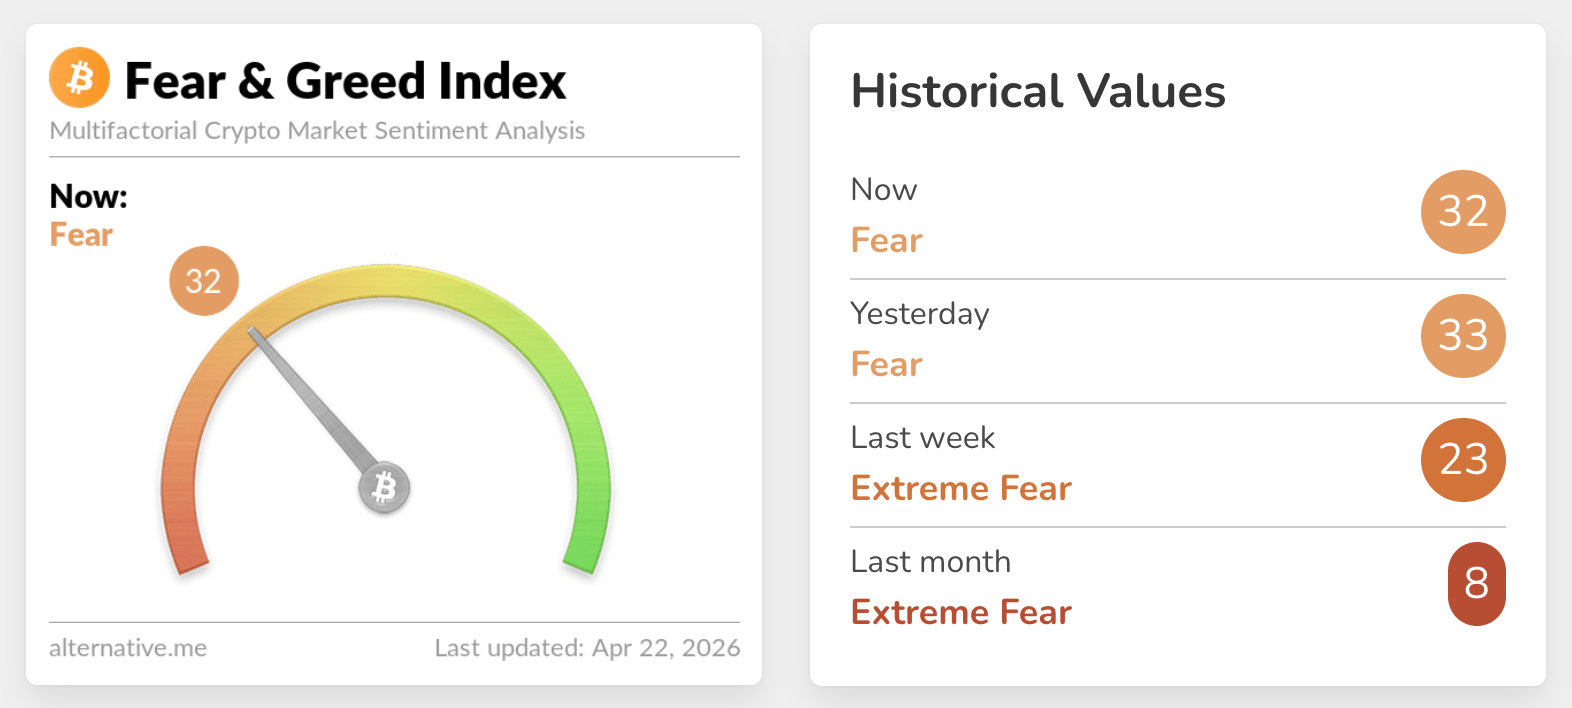
The Crypto Fear & Greed Index sits at 32 in the fear territory on Wednesday, up from 23 last week and 8 in extreme fear territory in March. If sentiment continues to improve, risk appetite for risk assets like XRP would increase along with bullish conviction.
XRP steadies rebound as bullish bets surge
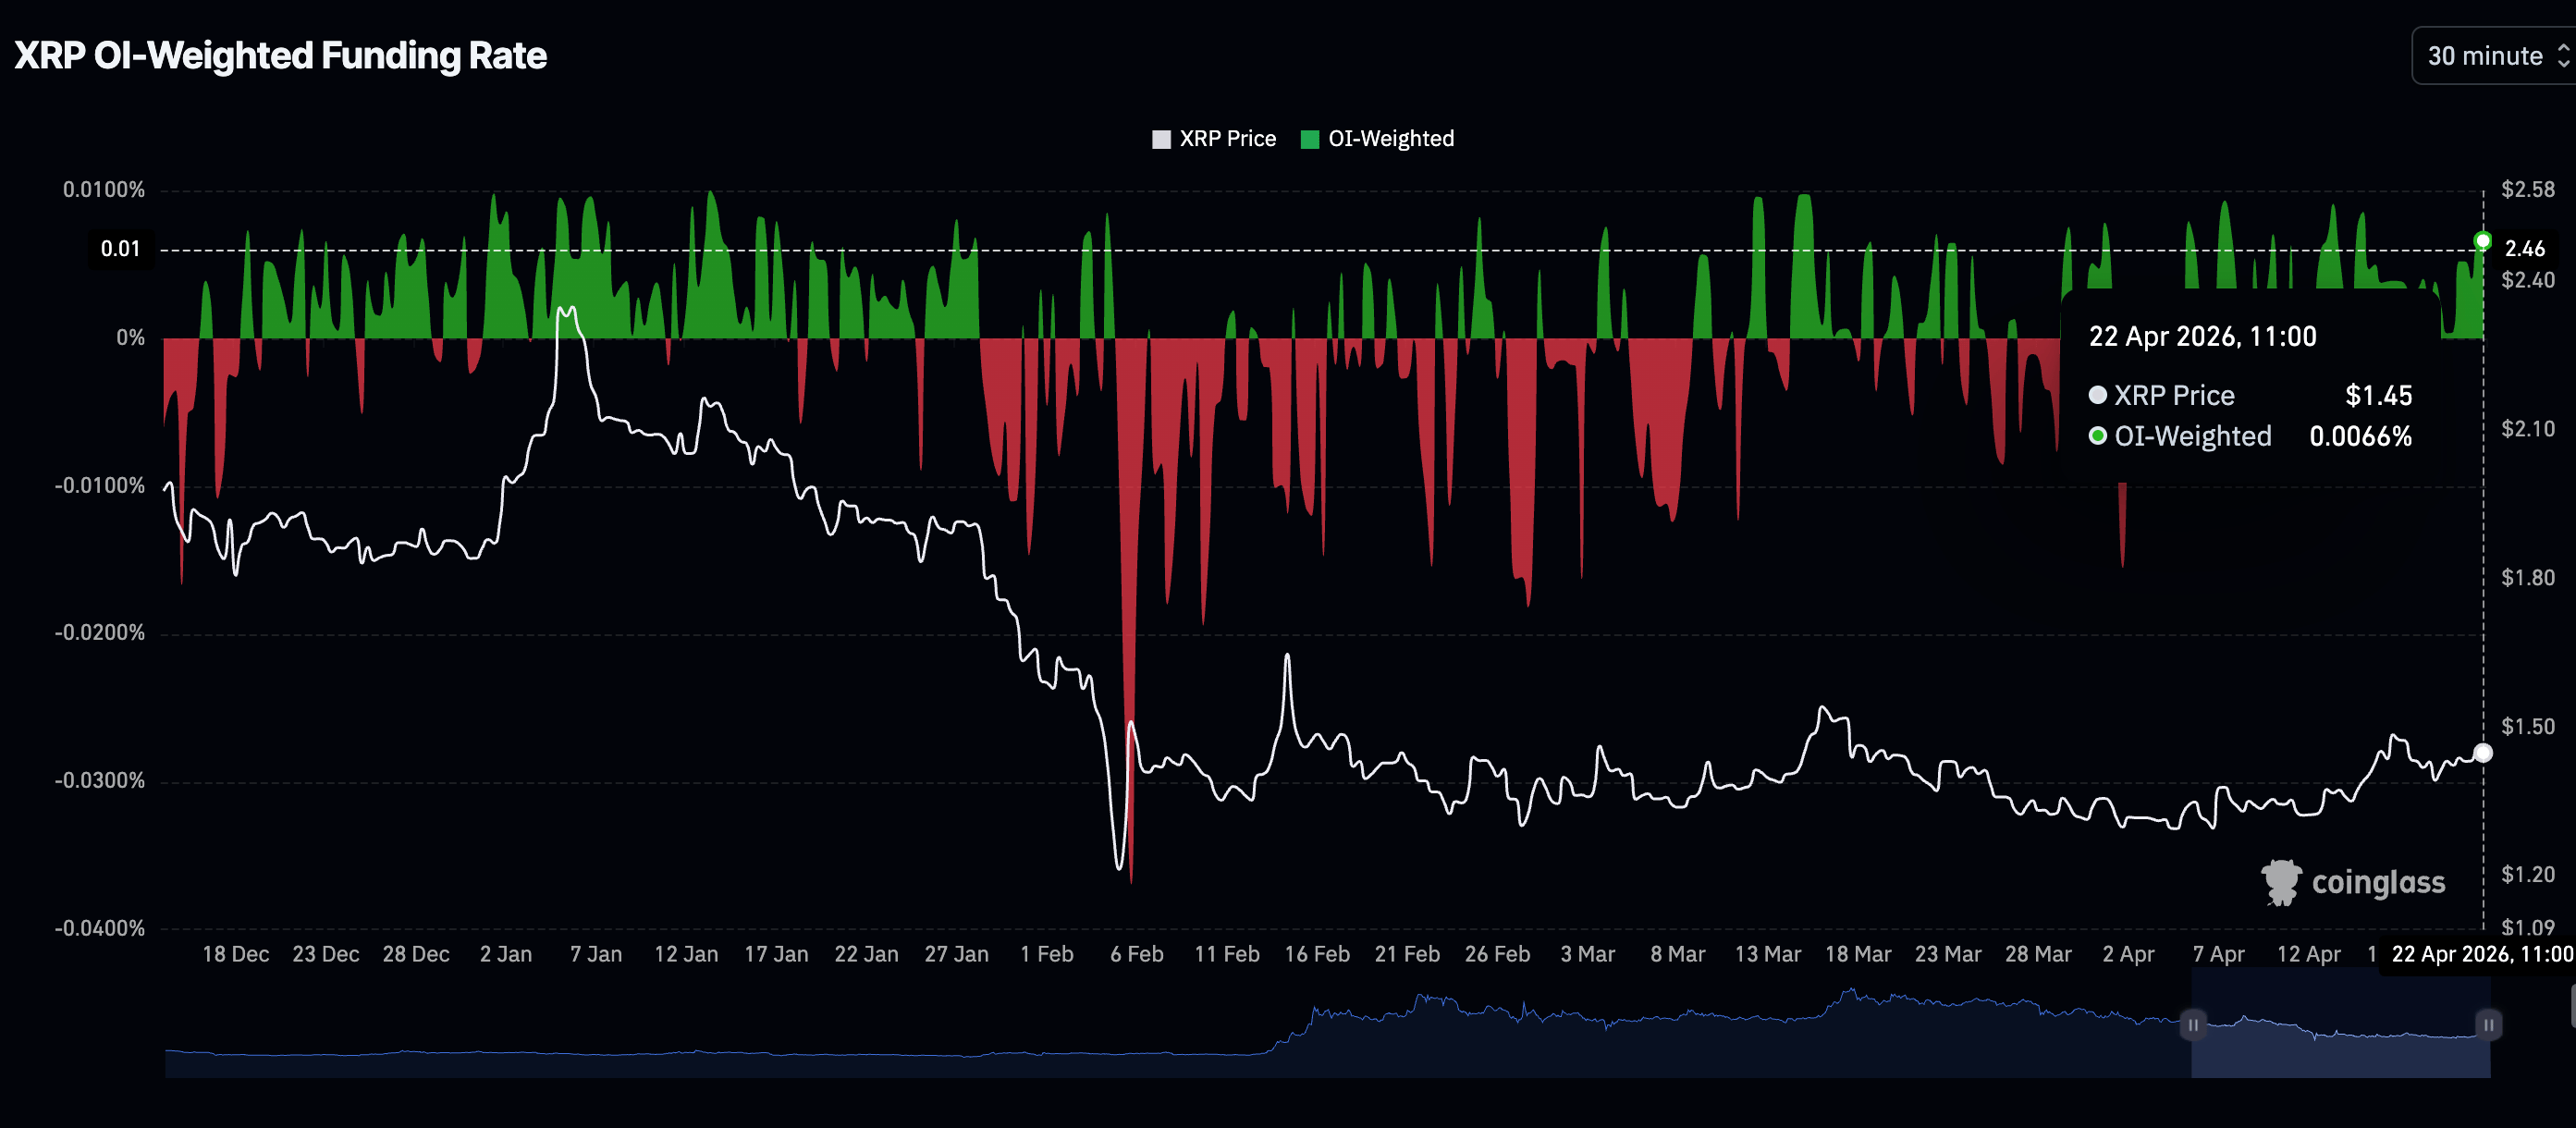
Interest in XRP remains elevated, as reflected by the Open Interest (OI)-Weighted Funding Rate averaging 0.0066% on Wednesday. CoinGlass data shows that the perpetual futures metric has stayed in positive territory since April 3, affirming an overall bullish outlook as traders increasingly hold long positions.
In other words, buyers are willing to pay a premium in fees to stay long while expecting an extended breakout. With the OI Weighted Funding Rate moderately positive at 0.0066%, the retail market is neither overstretched nor euphoric, suggesting potential for further upside price action.
Technical outlook: XRP poised for $1.54 breakout as momentum builds
XRP trades above $1.44, holding a neutral to slightly constructive near-term bias. The 50-day Exponential Moving Average (EMA) at $1.41 provides near-term support. Still, the remittance token remains capped below the 100-day EMA at $1.54 and the longer-term 200-day EMA at $1.78. Moreover, a long-standing downward-sloping resistance trend line, with a key break price near $1.68, continues to frame the broader corrective structure overhead.
On the other hand, momentum indicators lean supportive, with the Moving Average Convergence Divergence (MACD) histogram holding modestly above zero on the daily chart and the Relative Strength Index (RSI) around 58, suggesting positive but not overextended upside pressure.
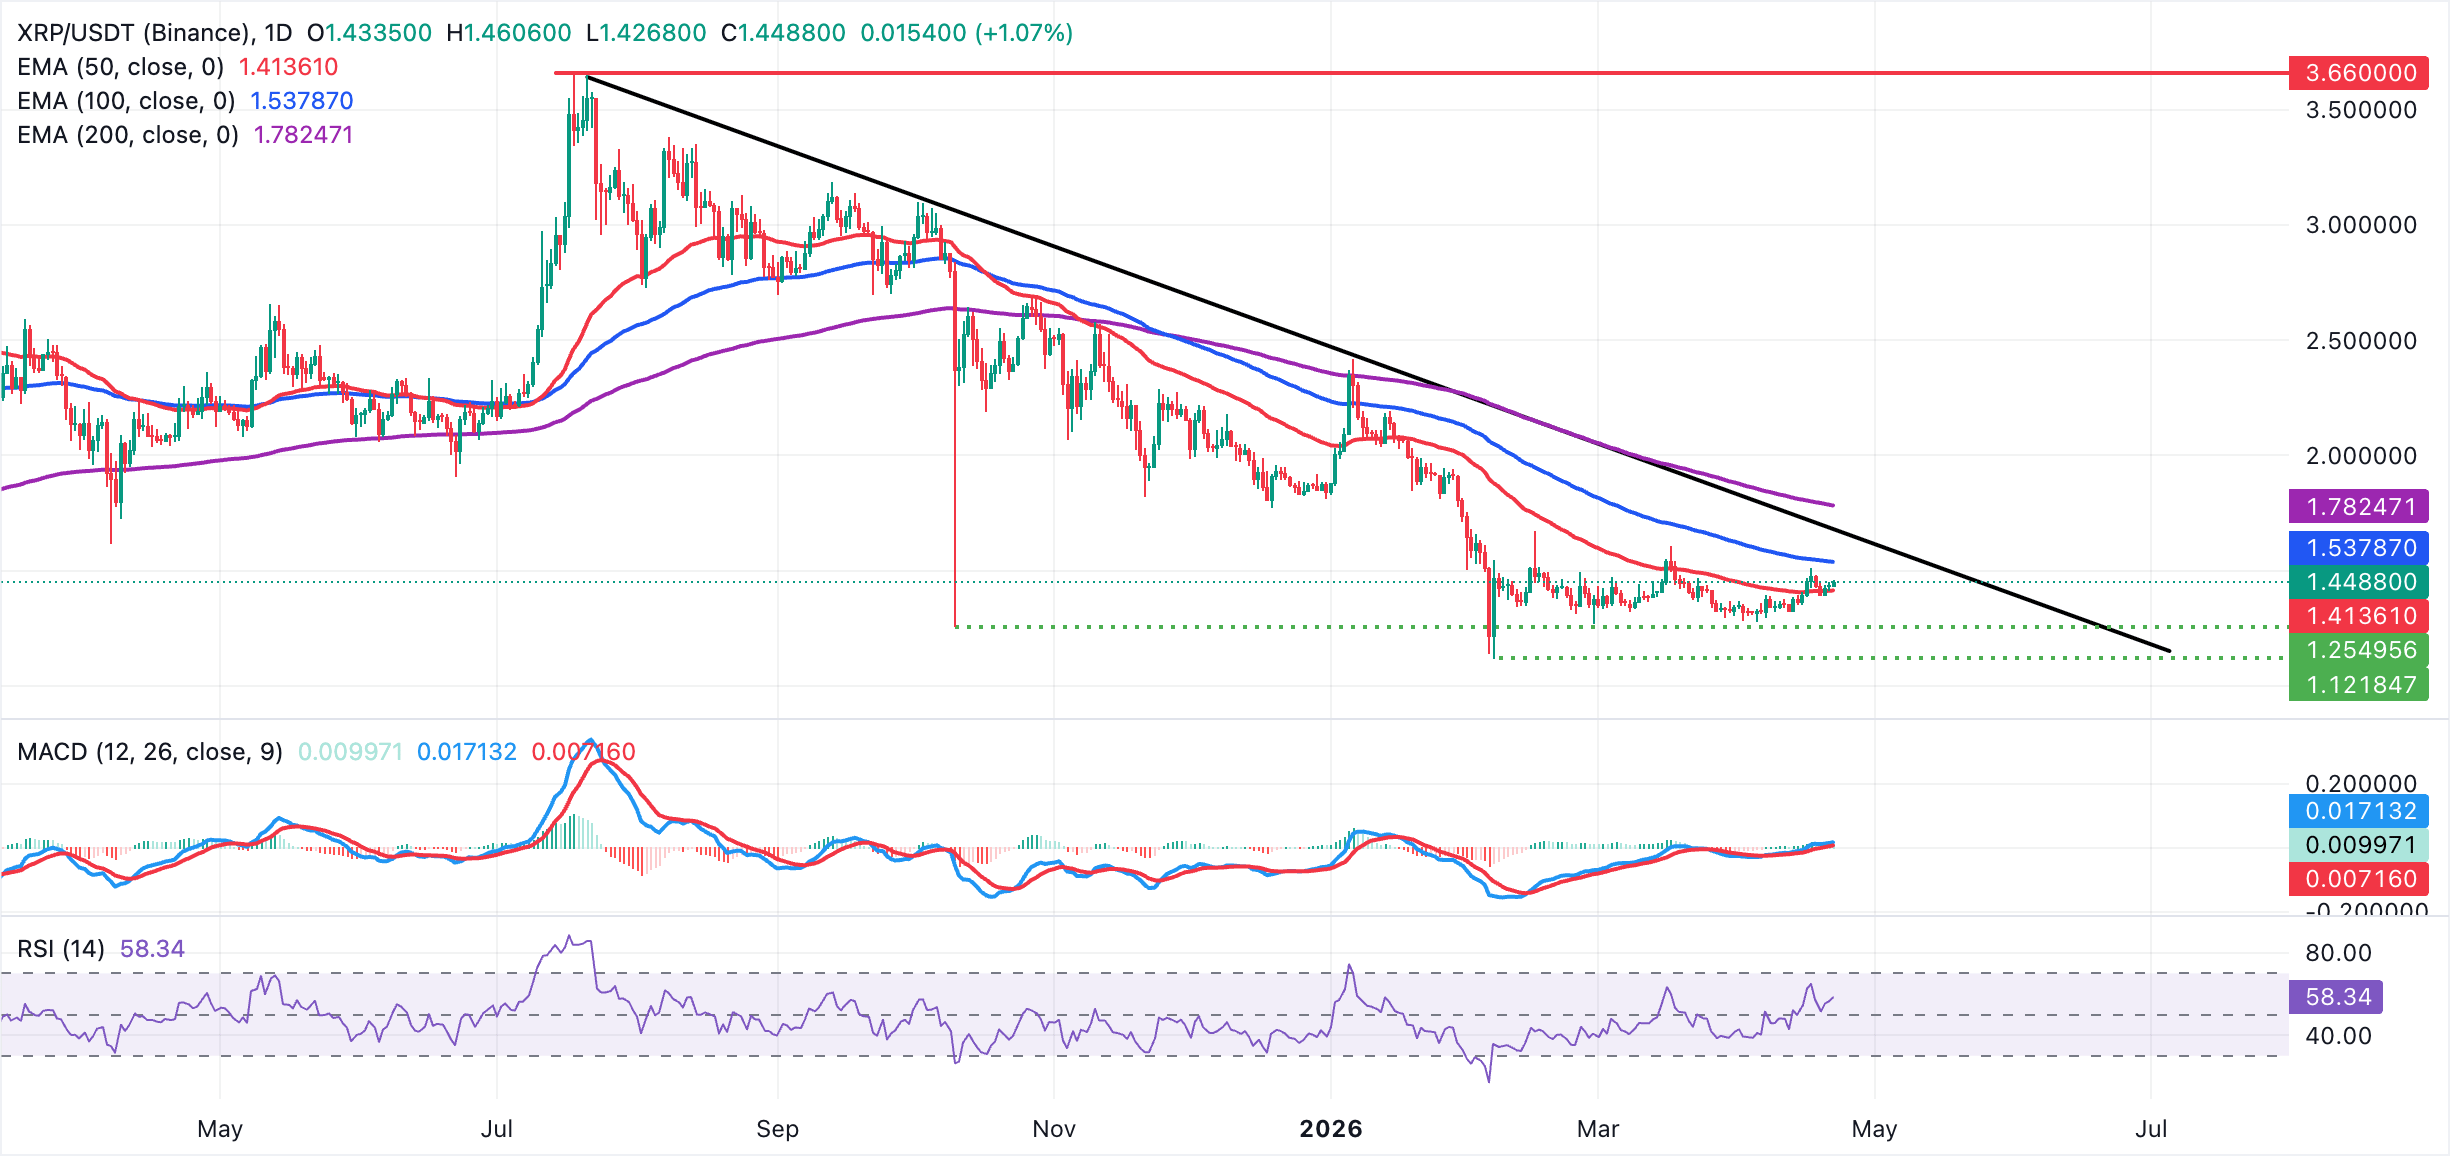
On the topside, immediate resistance lies at the 100-day EMA around $1.54, marking a 6% increase from the prevailing spot price. A sustained break above that area would expose the descending trendline near $1.68, ahead of the more strategic 200-day EMA at $1.78. On the downside, initial support is seen at the 50-day EMA at $1.41. A daily close back below this demand zone would weaken the current constructive tone and open the door to a deeper pullback within the broader downtrend.
(The technical analysis of this story was written with the help of an AI tool.)
Cryptocurrency metrics FAQs
The developer or creator of each cryptocurrency decides on the total number of tokens that can be minted or issued. Only a certain number of these assets can be minted by mining, staking or other mechanisms. This is defined by the algorithm of the underlying blockchain technology. On the other hand, circulating supply can also be decreased via actions such as burning tokens, or mistakenly sending assets to addresses of other incompatible blockchains.
Market capitalization is the result of multiplying the circulating supply of a certain asset by the asset’s current market value.
Trading volume refers to the total number of tokens for a specific asset that has been transacted or exchanged between buyers and sellers within set trading hours, for example, 24 hours. It is used to gauge market sentiment, this metric combines all volumes on centralized exchanges and decentralized exchanges. Increasing trading volume often denotes the demand for a certain asset as more people are buying and selling the cryptocurrency.
Funding rates are a concept designed to encourage traders to take positions and ensure perpetual contract prices match spot markets. It defines a mechanism by exchanges to ensure that future prices and index prices periodic payments regularly converge. When the funding rate is positive, the price of the perpetual contract is higher than the mark price. This means traders who are bullish and have opened long positions pay traders who are in short positions. On the other hand, a negative funding rate means perpetual prices are below the mark price, and hence traders with short positions pay traders who have opened long positions.
Author

John Isige
FXStreet
John Isige is a seasoned cryptocurrency journalist and markets analyst committed to delivering high-quality, actionable insights tailored to traders, investors, and crypto enthusiasts. He enjoys deep dives into emerging Web3 tren



