Quant Price Forecast: 50-day EMA rebound brings September’s 370% rally back in focus
- Quant hovers around $189 on Monday, holding above its 50-day EMA around $171 with a 6% rebound the previous day.
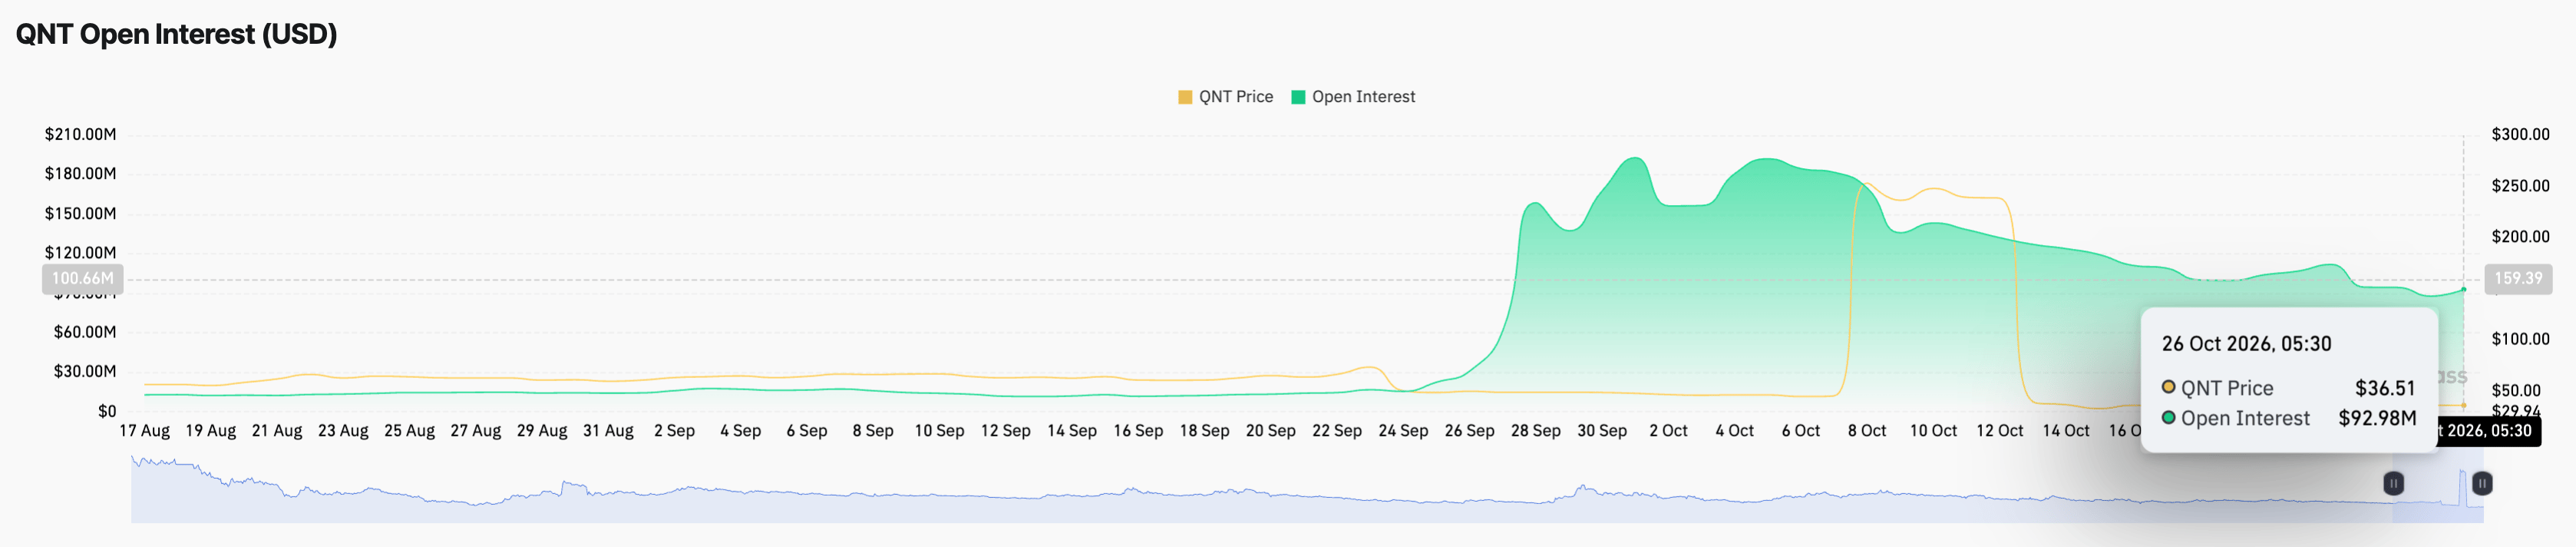
- QNT derivatives hold firm retail demand, with Open Interest stabilizing above $90 million.
- Quant’s technical outlook loses its near-term bearishness, as pullback momentum eases to neutral with the 50-day EMA at $171 in focus.

Quant (QNT) trades around $189 on Monday, sustaining its 6% rebound from the previous day as the bulls attempt to extend September’s rally. QNT Open Interest hovers above $90 million, reflecting firm retail demand in the Decentralized Finance (DeFi) token. The technical outlook highlights a potential rebound from the 50-day Exponential Moving Average (EMA) around $171, amid weakening downside momentum.
Retail demand in QNT holds firm
Quant holds firm retail strength in the leverage market. CoinGlass data shows QNT Open Interest (OI) at $92.98 million, up from $87.90 million the previous day, indicating a stabilization of its pullback from $192.16 million on October 5. This stabilization of the declining notional value of active contracts suggests that the decline in the spot price and the positional wipeout have eased, implying bullish anticipation among traders.
Technical outlook: Will QNT price reclaim $200?
QNT trades at $189 at press time on Monday, holding a constructive bullish bias following the 370% rally in September. QNT price shows signs of stability near the 50-day EMA at $171, which sits well above the 200-day EMA at $109, reaffirming a long-term constructive tone.
The recovery from the 50-day EMA aligns with the 50% retracement, measured from $60 to $373, at $150, which now underpins the advance. A confirmed breakout above last week's high of $212 could renew the upward trend, paving the way toward the $373 peak.
The Moving Average Convergence Divergence (MACD) line is marginally below its signal line, hinting at a gradual sideways shift as the negative histogram profile contracts, while the Relative Strength Index (RSI) sits just below the neutral 50 mark. Taken together, the indicators suggest a consolidation phase rather than aggressive selling.
On the downside, immediate support is seen at the 50-day EMA at $171, reinforced by the 50% retracement at $150.
(The technical analysis of this story was written with the help of an AI tool. Know more.)
Author

Vishal Dixit
FXStreet
Vishal Dixit holds a B.Sc. in Chemistry from Wilson College but found his true calling in the world of crypto.



