Pi Network Price Forecast: Five-day rally tests 100-day EMA and channel breakout
- Pi Network extends gains for the fifth consecutive day on Tuesday, testing the 100-day EMA breakout.
- Data shows increased social interest in the PI token, fueling the short-term recovery.
- The technical outlook is mildly bullish as the price also tests a downward channel breakout.

Pi Network (PI) extends recovery for the fifth consecutive day, trading above the 100-day Exponential Moving Average (EMA) and a key trendline near $0.1853. Renewed social interest in the PI token, ahead of the upcoming Pi founders' speech at the Consensus 2026 event, is likely the driving force behind the rally. A potential breakout in PI must surpass the $0.20 level for a sustained move toward the 200-day EMA at $0.2390.
Retail demand for PI heightens ahead of Consensus 2026
Pi Network token shows a short-term recovery, gaining traction ahead of the scheduled talk by Pi founders Chengdiao Fan and Nicolas Kokkalis at the Consensus 2026 event between May 5 and 7.
Fan will speak on “Aligning Web3, AI, and Blockchain for Utility,” while Kokkalis will deliver a talk on “How to Prove You’re Human in an AI World (Without Doxing Yourself).” These talks address the strength of Pi Network: its 18 million verified user base and ongoing mainnet upgrades focused on AI-driven Web3 utility.
Kokkalis's return at the event alongside his co-founder has renewed retail attention in the Pi Network. Santiment data shows a recovery in social interest, with social dominance at 0.027% and a social volume of 20 on Monday, backing the five-day rally.
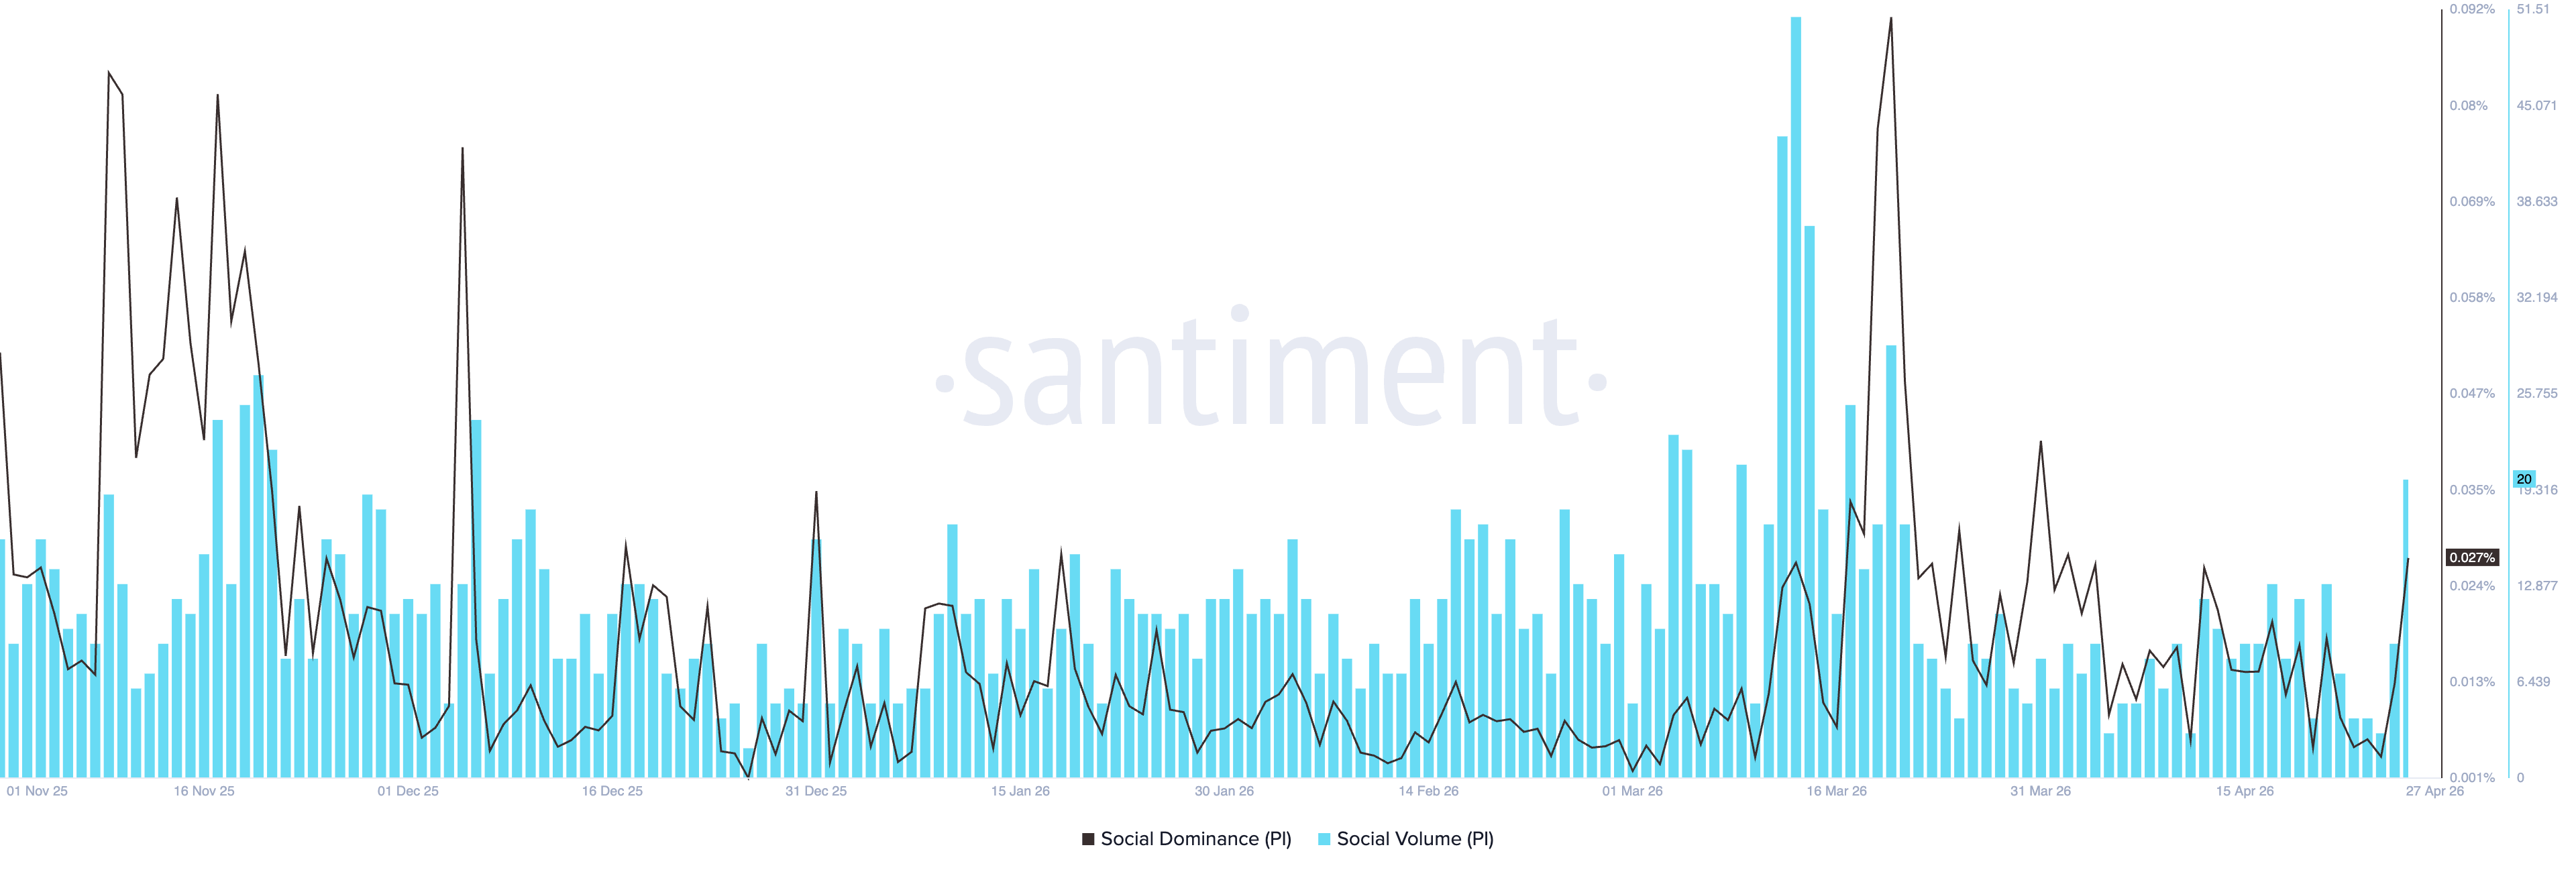
However, PI token tracks a “buy the news, sell the event” behavior, resulting in an early rally that fades as the actual event date approaches, as previously reported by FXStreet. Considering this, the PI token rally carries the risk of topping out if social interest continues its downtrend as Consensus 2026 approaches.
Will Pi Network rally cross above $0.20?
Pi Network holds a mildly bullish bias in the near-term as price crosses above the 100-day EMA barrier at $0.1853, aligning with a resistance trendline of a downward channel. Meanwhile, the 200-day EMA near $0.2390 remains a distant cap.
The Relative Strength Index (RSI) at 63 on the daily chart pushes above the midline, suggesting strengthening upside momentum. At the same time, the Moving Average Convergence Divergence (MACD) line rises above the zero line as positive histogram expands, supporting the bullish bias.
On the topside, a decisive close above the 100-day EMA at $0.1853 would confirm the downward channel breakout, opening the path toward the $0.2000 psychological level. If PI exceeds this psychological barrier, it could bring the 200-day EMA at $0.2390 on bullish radar, and a daily close above this longer-term average would unlock a more sustained recovery phase.
On the downside, initial support is seen at the 100-day EMA near $0.1853, followed by the 50-day EMA near $0.1774, where buyers would likely attempt to defend the emerging uptrend.
(The technical analysis of this story was written with the help of an AI tool.)
Author

Vishal Dixit
FXStreet
Vishal Dixit holds a B.Sc. in Chemistry from Wilson College but found his true calling in the world of crypto.