PancakeSwap Price Forecast: CAKE eyes upside as derivatives and technical outlook turn bullish
- PancakeSwap finds support around key level at $1.55, hinting at an upside move ahead.
- Rising open interest alongside positive funding rates signals increasing participation.
- The technical outlook suggests further gains as momentum indicators show bullish bias.

PancakeSwap (CAKE) trades in green above $1.60 on Thursday after finding support around the key level the previous day. Improving derivatives metrics, alongside constructive price action, suggest CAKE could extend its upward move in the coming days.
CAKE’s derivatives data shows bullish bias
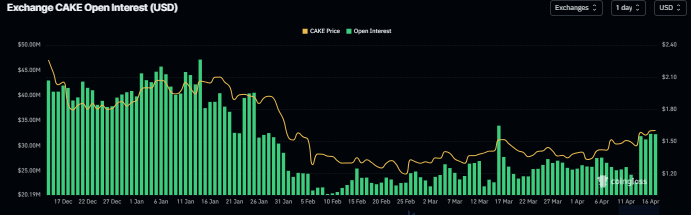
CoinGlass data shows that the futures’ Open Interest (OI) at exchanges for PancakeSwap rose sharply to $31.89 million on Tuesday and has been steadily rising, reaching $32.28 million on Thursday, the highest level since March 17. An increasing OI indicates new or additional money entering the market and new buying, which could help sustain CAKE's price rally.
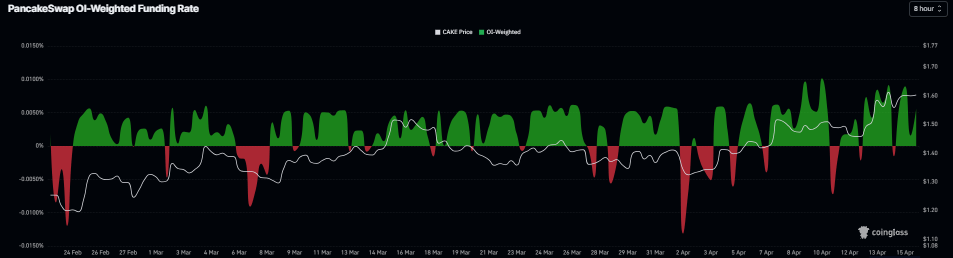
In addition, the funding rates also support improving sentiment. CoinGlass’ OI-Weighted Funding Rate data for CAKE flipped positive on Wednesday and reads 0.0056% on Thursday. This positive rate indicates that longs are paying shorts and projecting a bullish sentiment.
PancakeSwap Price Forecast: Momentum indicators signal bullish strength
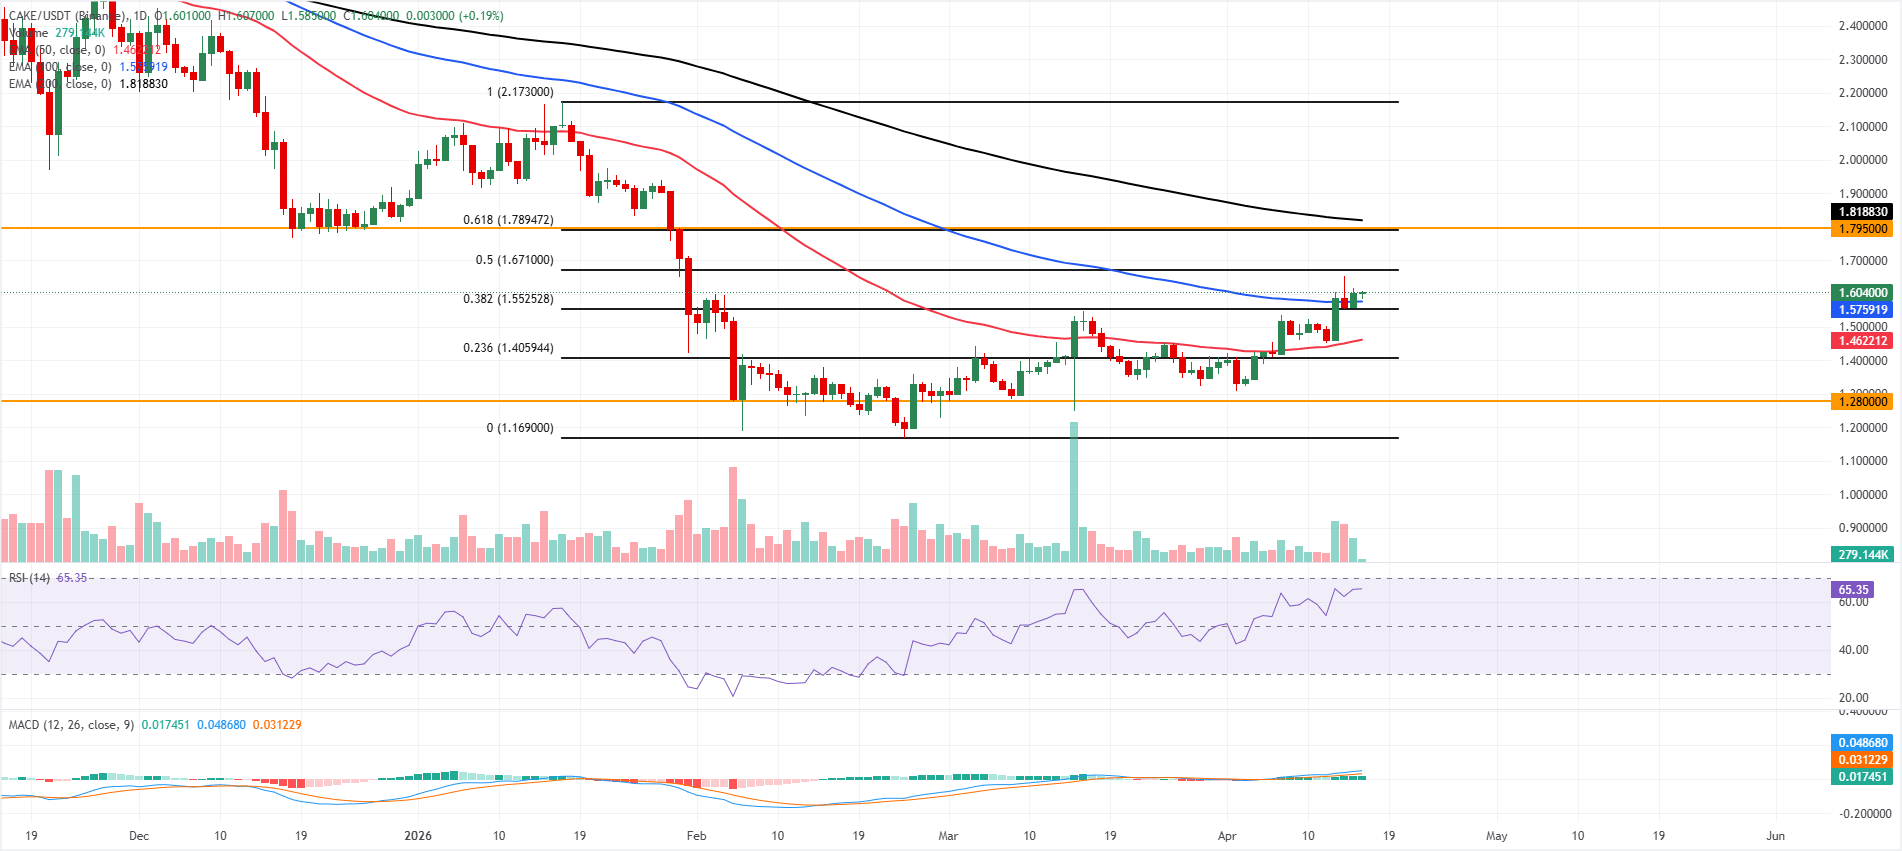
PancakeSwap price is trading at $1.60 on Thursday, retaining a constructive bias as price holds above the 50-day and 100-day Exponential Moving Averages (EMAs) at $1.46 and $1.57, respectively. This positioning suggests the recent advance is supported by underlying demand, even as the pair remains well below the 200-day EMA at $1.81, which defines the upper boundary of the broader corrective structure.
The Relative Strength Index (RSI) on the daily chart reads 65, leaning toward overbought territory, suggesting upside momentum is firm but vulnerable to consolidation, while the Moving Average Convergence Divergence (MACD) remains positive, reinforcing a bullish short-term tone.
On the topside, initial resistance is aligned with the 50% retracement of the latest swing at $1.67, ahead of a more substantial barrier formed by the 61.8% level at $1.78 and the nearby horizontal resistance at $1.79. Beyond that, the 200-day EMA is at $1.81.
On the downside, the 100-day EMA at $1.57 offers immediate support, followed by the 38.2% retracement at $1.55; a deeper pullback would expose the 50-day EMA at $1.46 and the 23.6% Fibonacci level at $1.40, with stronger structural support emerging near $1.28.
(The technical analysis of this story was written with the help of an AI tool.)
Author

Manish Chhetri
FXStreet
Manish Chhetri is a crypto specialist with over four years of experience in the cryptocurrency industry.




