Ondo Price Forecast: ONDO risks deeper losses below $0.40 as retail demand wanes
- Ondo corrects nearly 20% from its monthly high at $0.49 and trades below $0.40 on Wednesday.
- Ondo retail demand cools, with perpetual Open Interest falling to $201 million.
- The 200-day EMA caps Ondo’s immediate upside, while weakening momentum indicators suggest intensifying overhead pressure.

Ondo Finance (ONDO) is facing mounting selling pressure on Wednesday, trading below the pivotal $0.4000 threshold. After logging two consecutive days of declines and extending its correction from its May peak at $0.4877, ONDO is at risk of a deeper correction.
Ondo falters as retail retreats
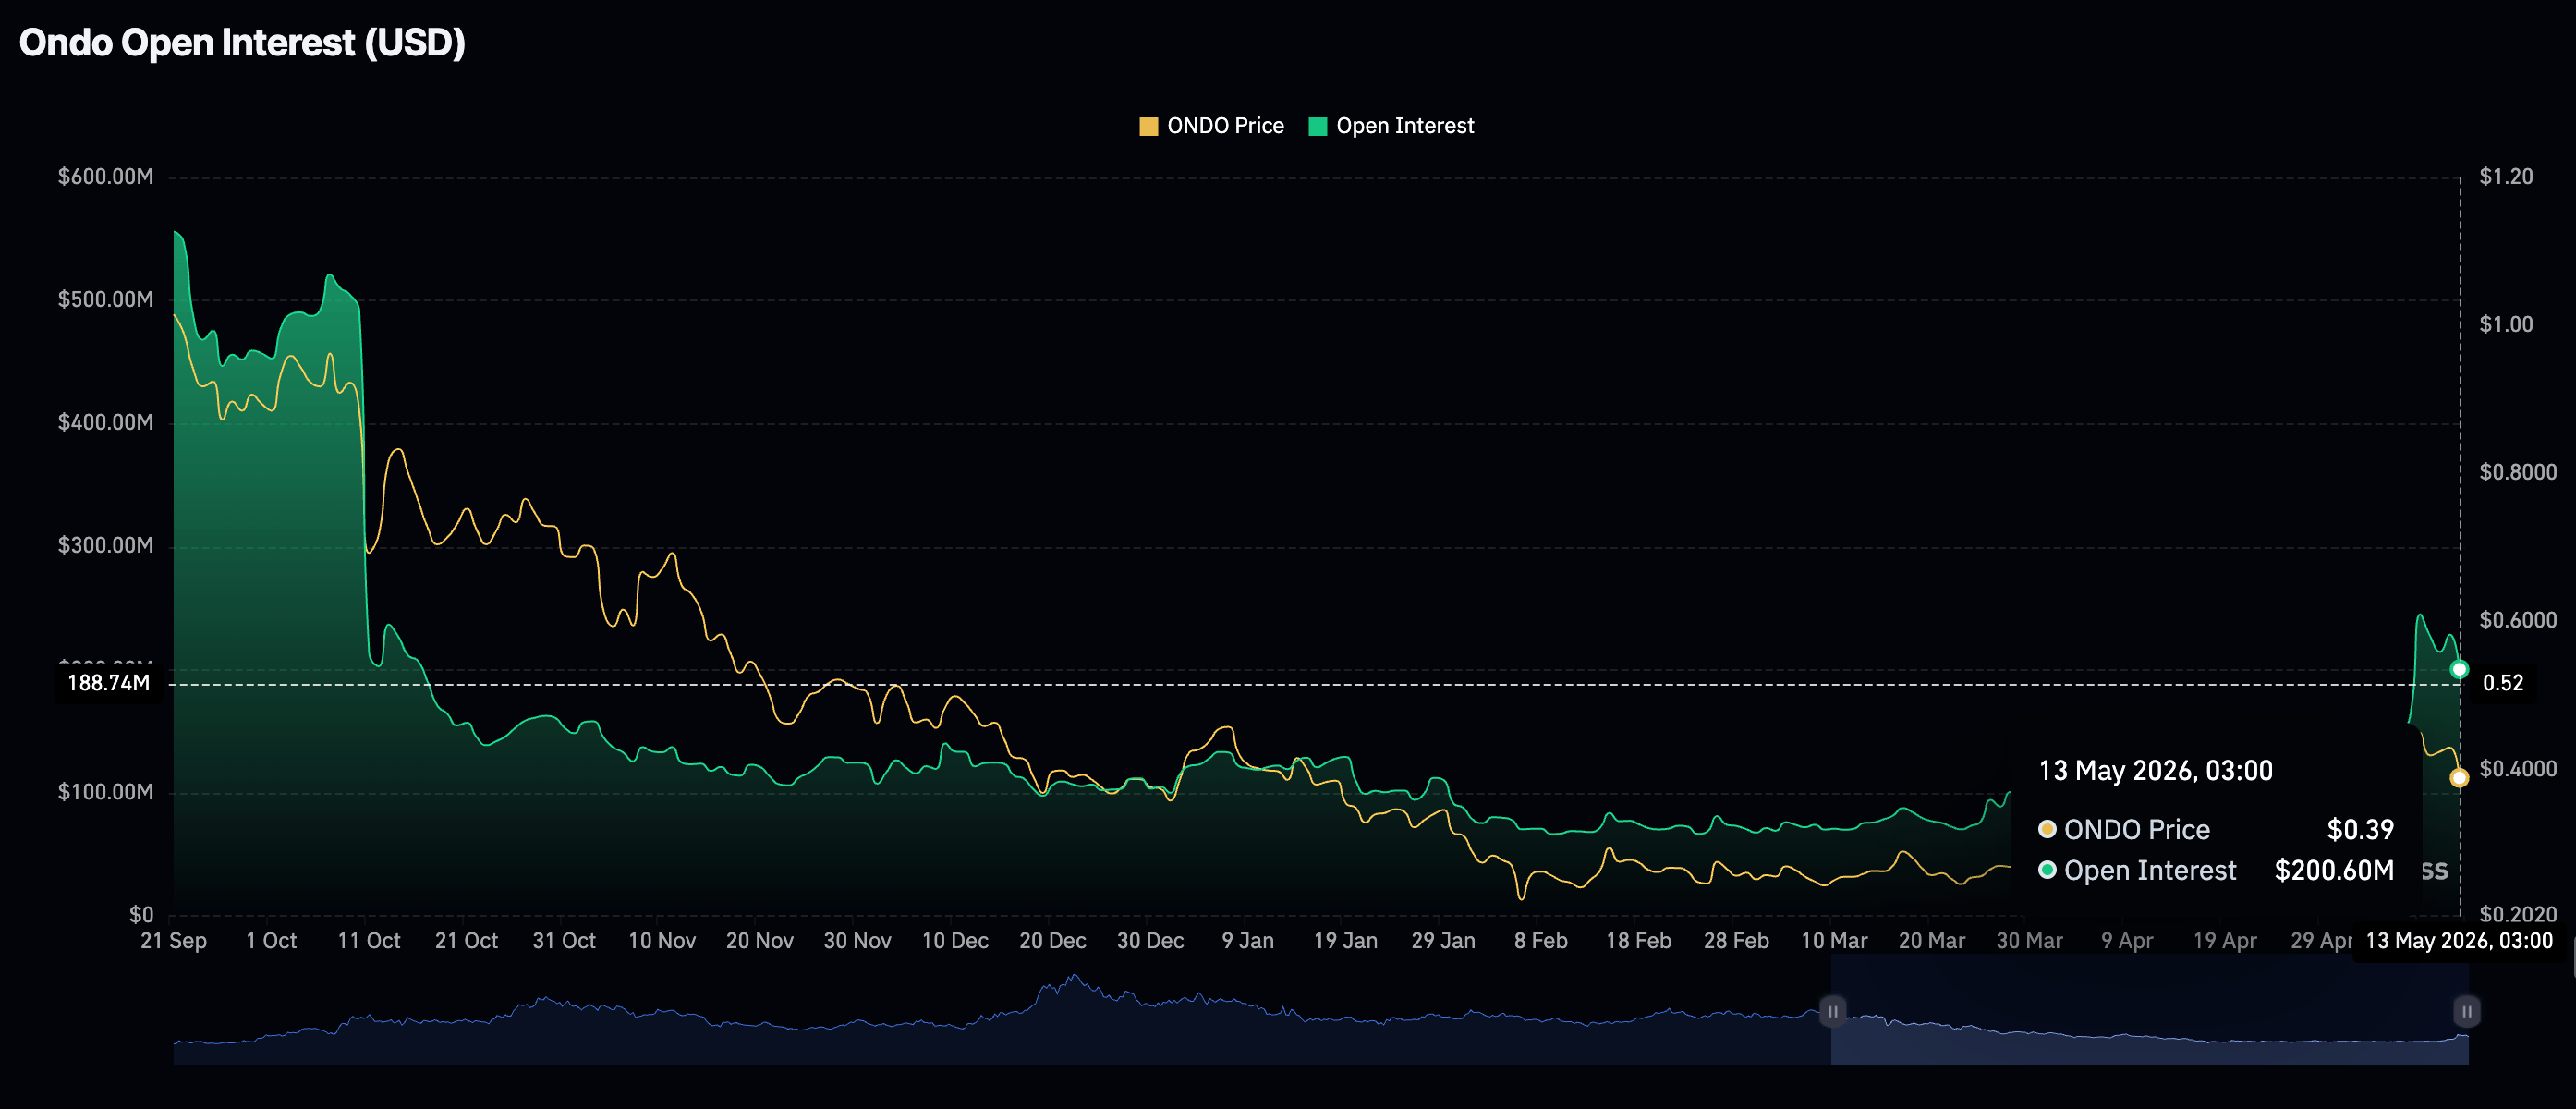
Ondo’s rally in the first week of May was primarily driven by growing retail appetite, driving futures Open Interest (OI) to $245 million, the highest level since October. This followed the first-ever successful interbank settlement of tokenized short-term United States (US) Treasuries' pilot in collaboration with JPMorgan, Mastercard and Ripple.
Open Interest has steadily declined, dropping from nearly $229 million to $201 million as of Wednesday. The waning demand in the derivatives market signals diminishing investor confidence in Ondo’s uptrend, prompting participants to reduce risk exposure and putting additional pressure on price.
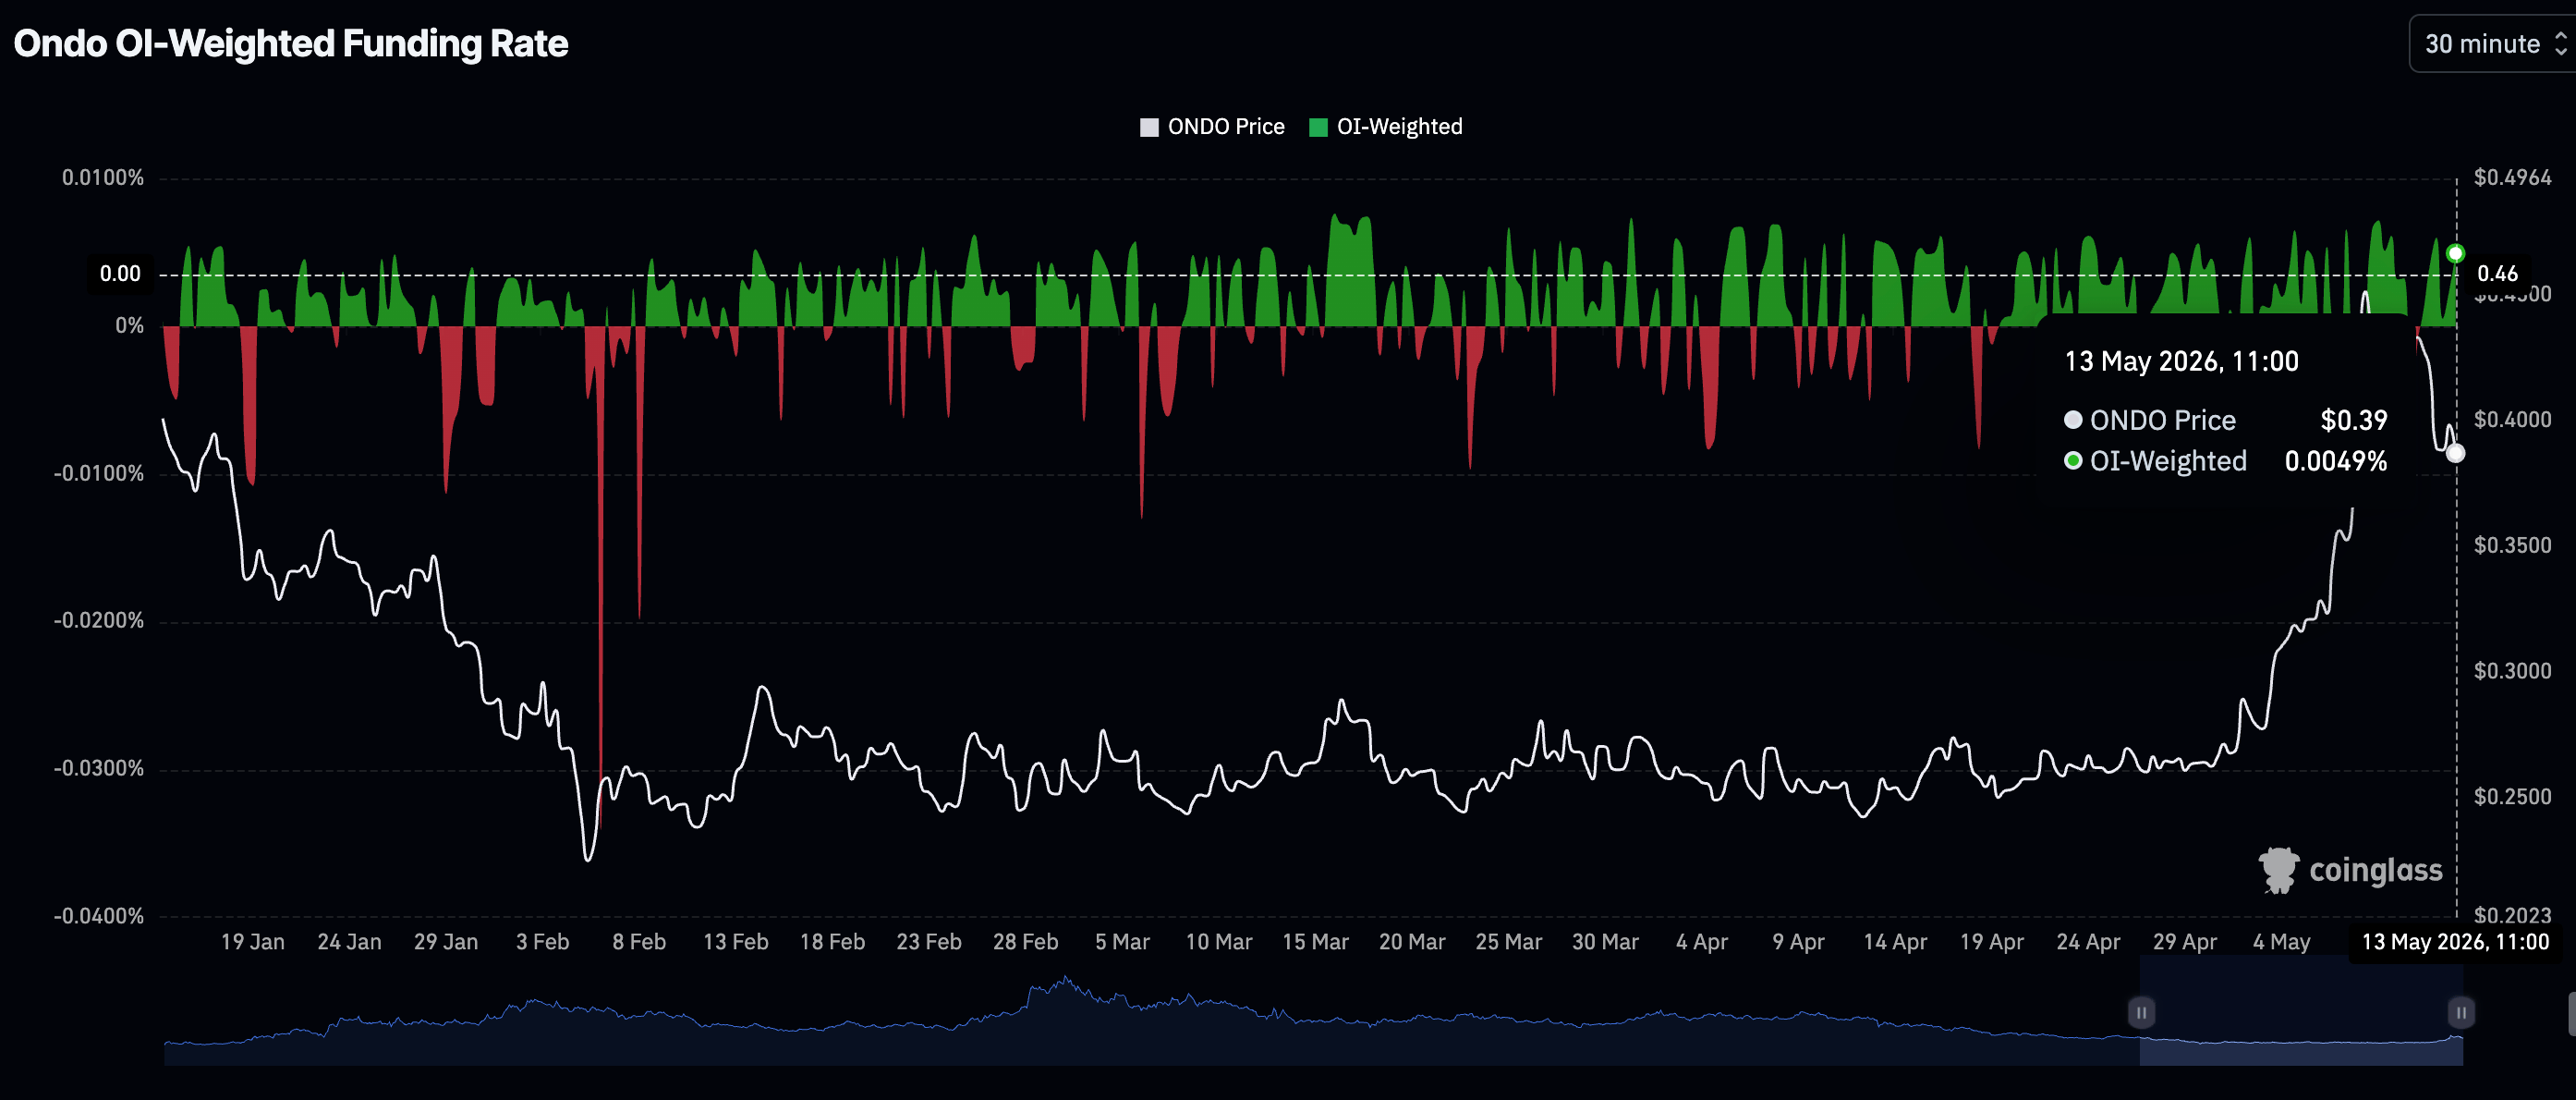
Despite the drop in OI and the price, traders appear to be backing a potential turnaround, as Ondo’s futures Weighted Funding Rate remains at 0.0049% in the positive region.
Positive funding rates indicate that long-positioned traders remain dominant and are willing to pay a premium to maintain their leveraged orders. With this level of conviction, Ondo may rebound amid fresh buy-the-dip demand.
Technical analysis: Ondo loses grip on support
Ondo trades at $0.3904, maintaining a constructive bullish bias as it holds well above the 50-day and 100-day Exponential Moving Averages (EMAs), clustered around $0.3100. The token also sits above the SuperTrend support near $0.3348.
The Moving Average Convergence Divergence (MACD) histogram remains positive on the daily chart while the Relative Strength Index (RSI) hovers in the mid-60s, both of which suggest sustained upside momentum even as the pair starts to edge into mildly stretched territory.
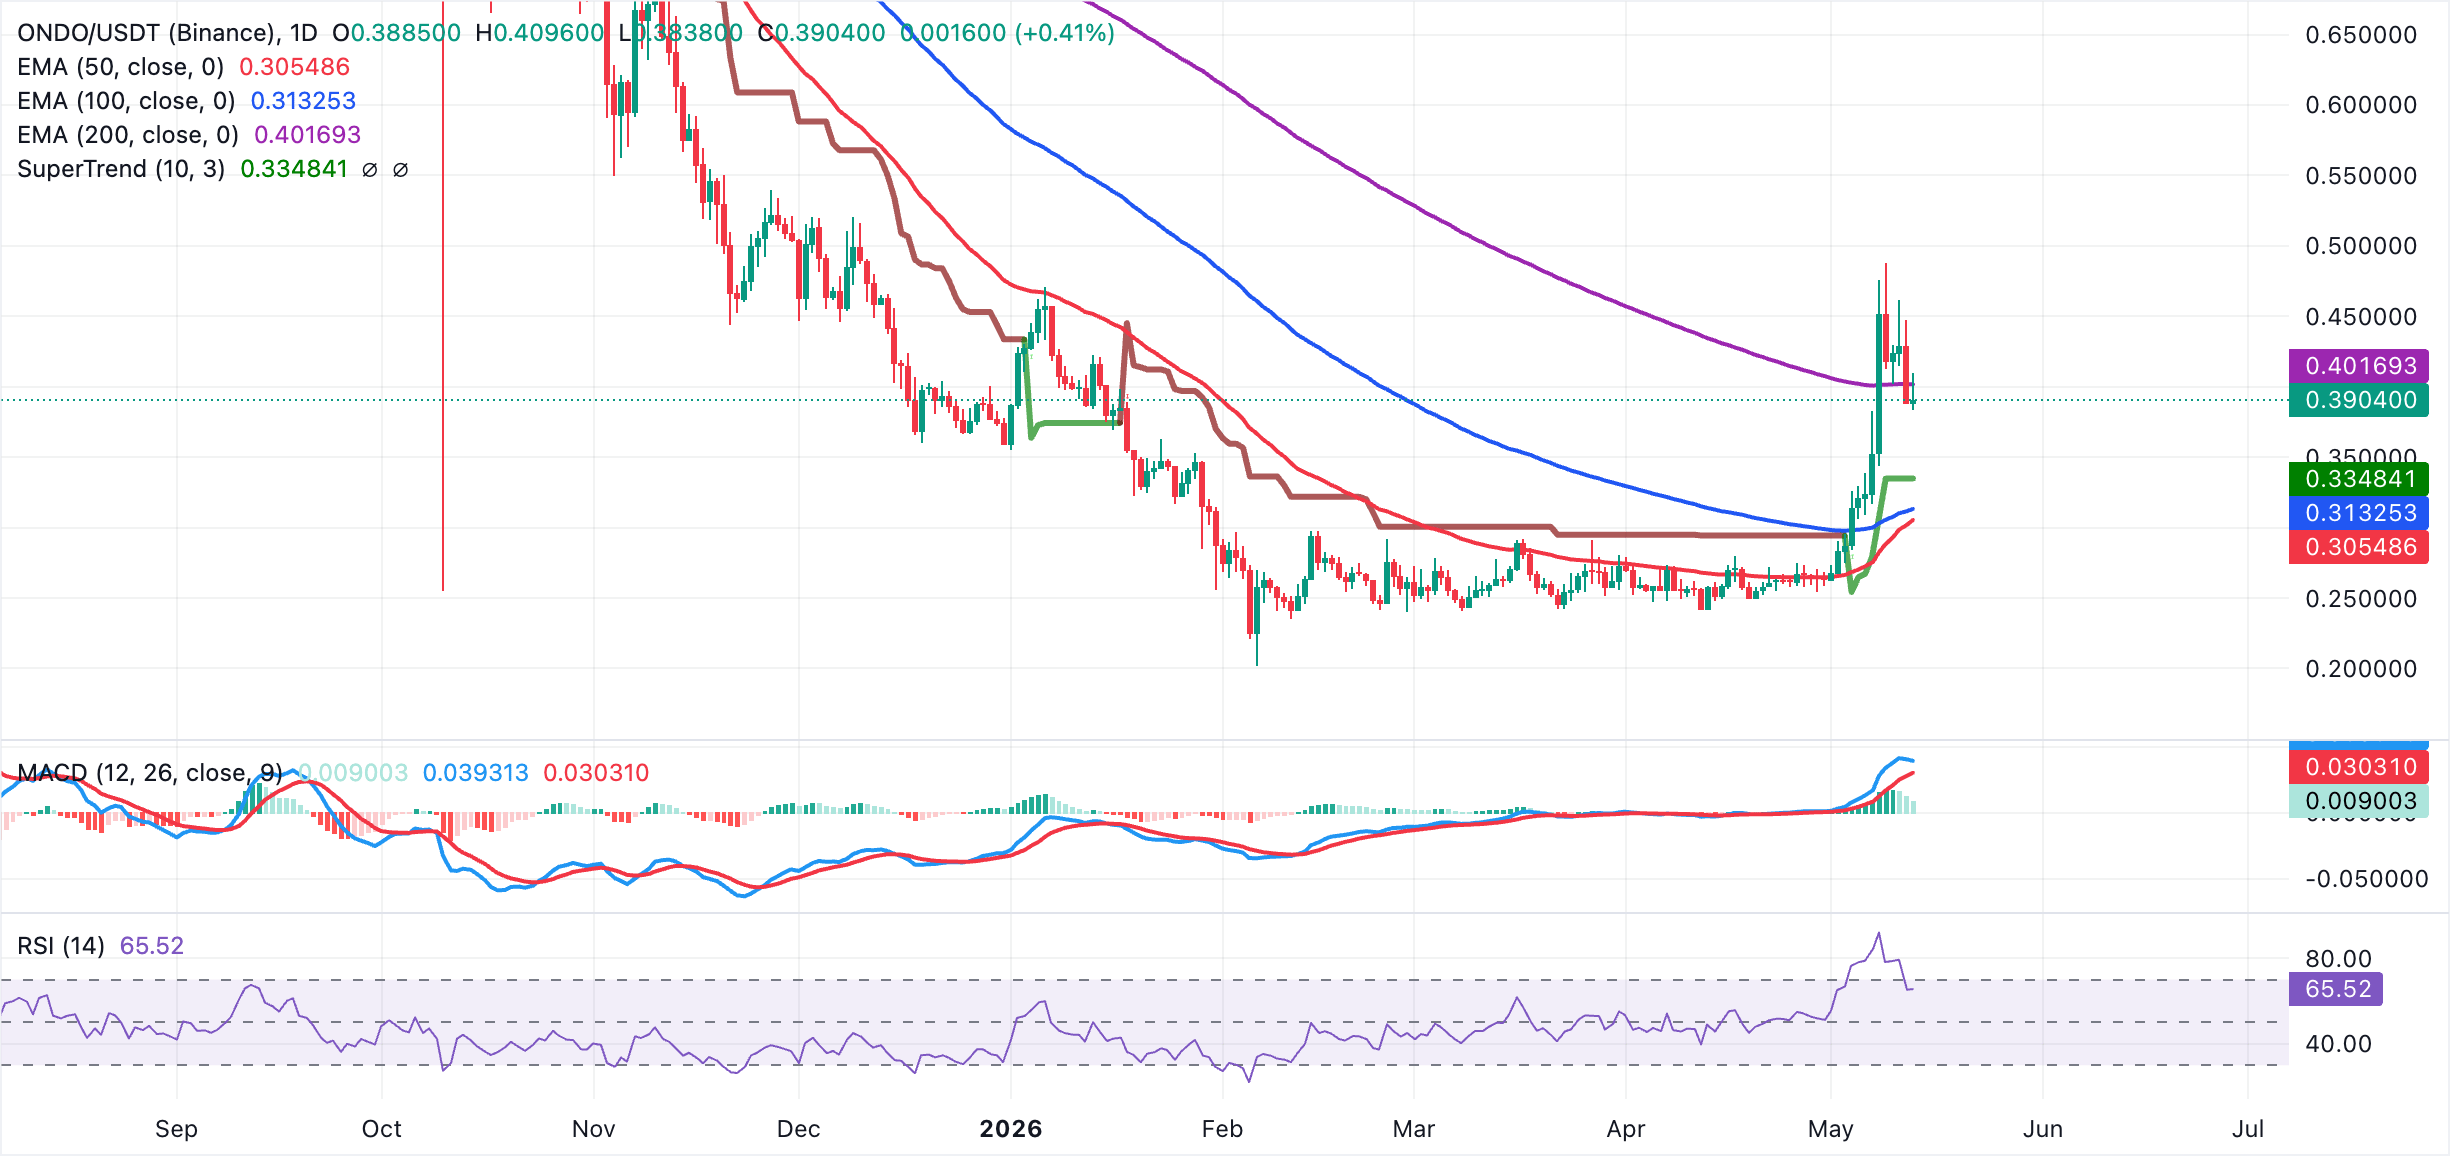
On the topside, immediate resistance lies at the 200-day EMA around $0.4017. A clean daily close above this level would open the door to a continuation of the recent rally. On the downside, initial support is seen at the SuperTrend line near $0.3348, with lower demand levels aligned with the 100-day EMA at $0.3132 and the 50-day EMA at $0.3055, where a pullback could still be absorbed without materially threatening the broader uptrend.
(The technical analysis of this story was written with the help of an AI tool.)
Open Interest, funding rate FAQs
Higher Open Interest is associated with higher liquidity and new capital inflow to the market. This is considered the equivalent of increase in efficiency and the ongoing trend continues. When Open Interest decreases, it is considered a sign of liquidation in the market, investors are leaving and the overall demand for an asset is on a decline, fueling a bearish sentiment among investors.
Funding fees bridge the difference between spot prices and prices of futures contracts of an asset by increasing liquidation risks faced by traders. A consistently high and positive funding rate implies there is a bullish sentiment among market participants and there is an expectation of a price hike. A consistently negative funding rate for an asset implies a bearish sentiment, indicating that traders expect the cryptocurrency’s price to fall and a bearish trend reversal is likely to occur.
Author

John Isige
FXStreet
John Isige is a seasoned cryptocurrency journalist and markets analyst committed to delivering high-quality, actionable insights tailored to traders, investors, and crypto enthusiasts. He enjoys deep dives into emerging Web3 tren



