Ondo Price Forecast: ONDO extends rally, targets $0.45 breakout
- Ondo rises by more than 16% on Friday and is close to reclaiming $0.45 following the launch of tokenized Treasury settlement.
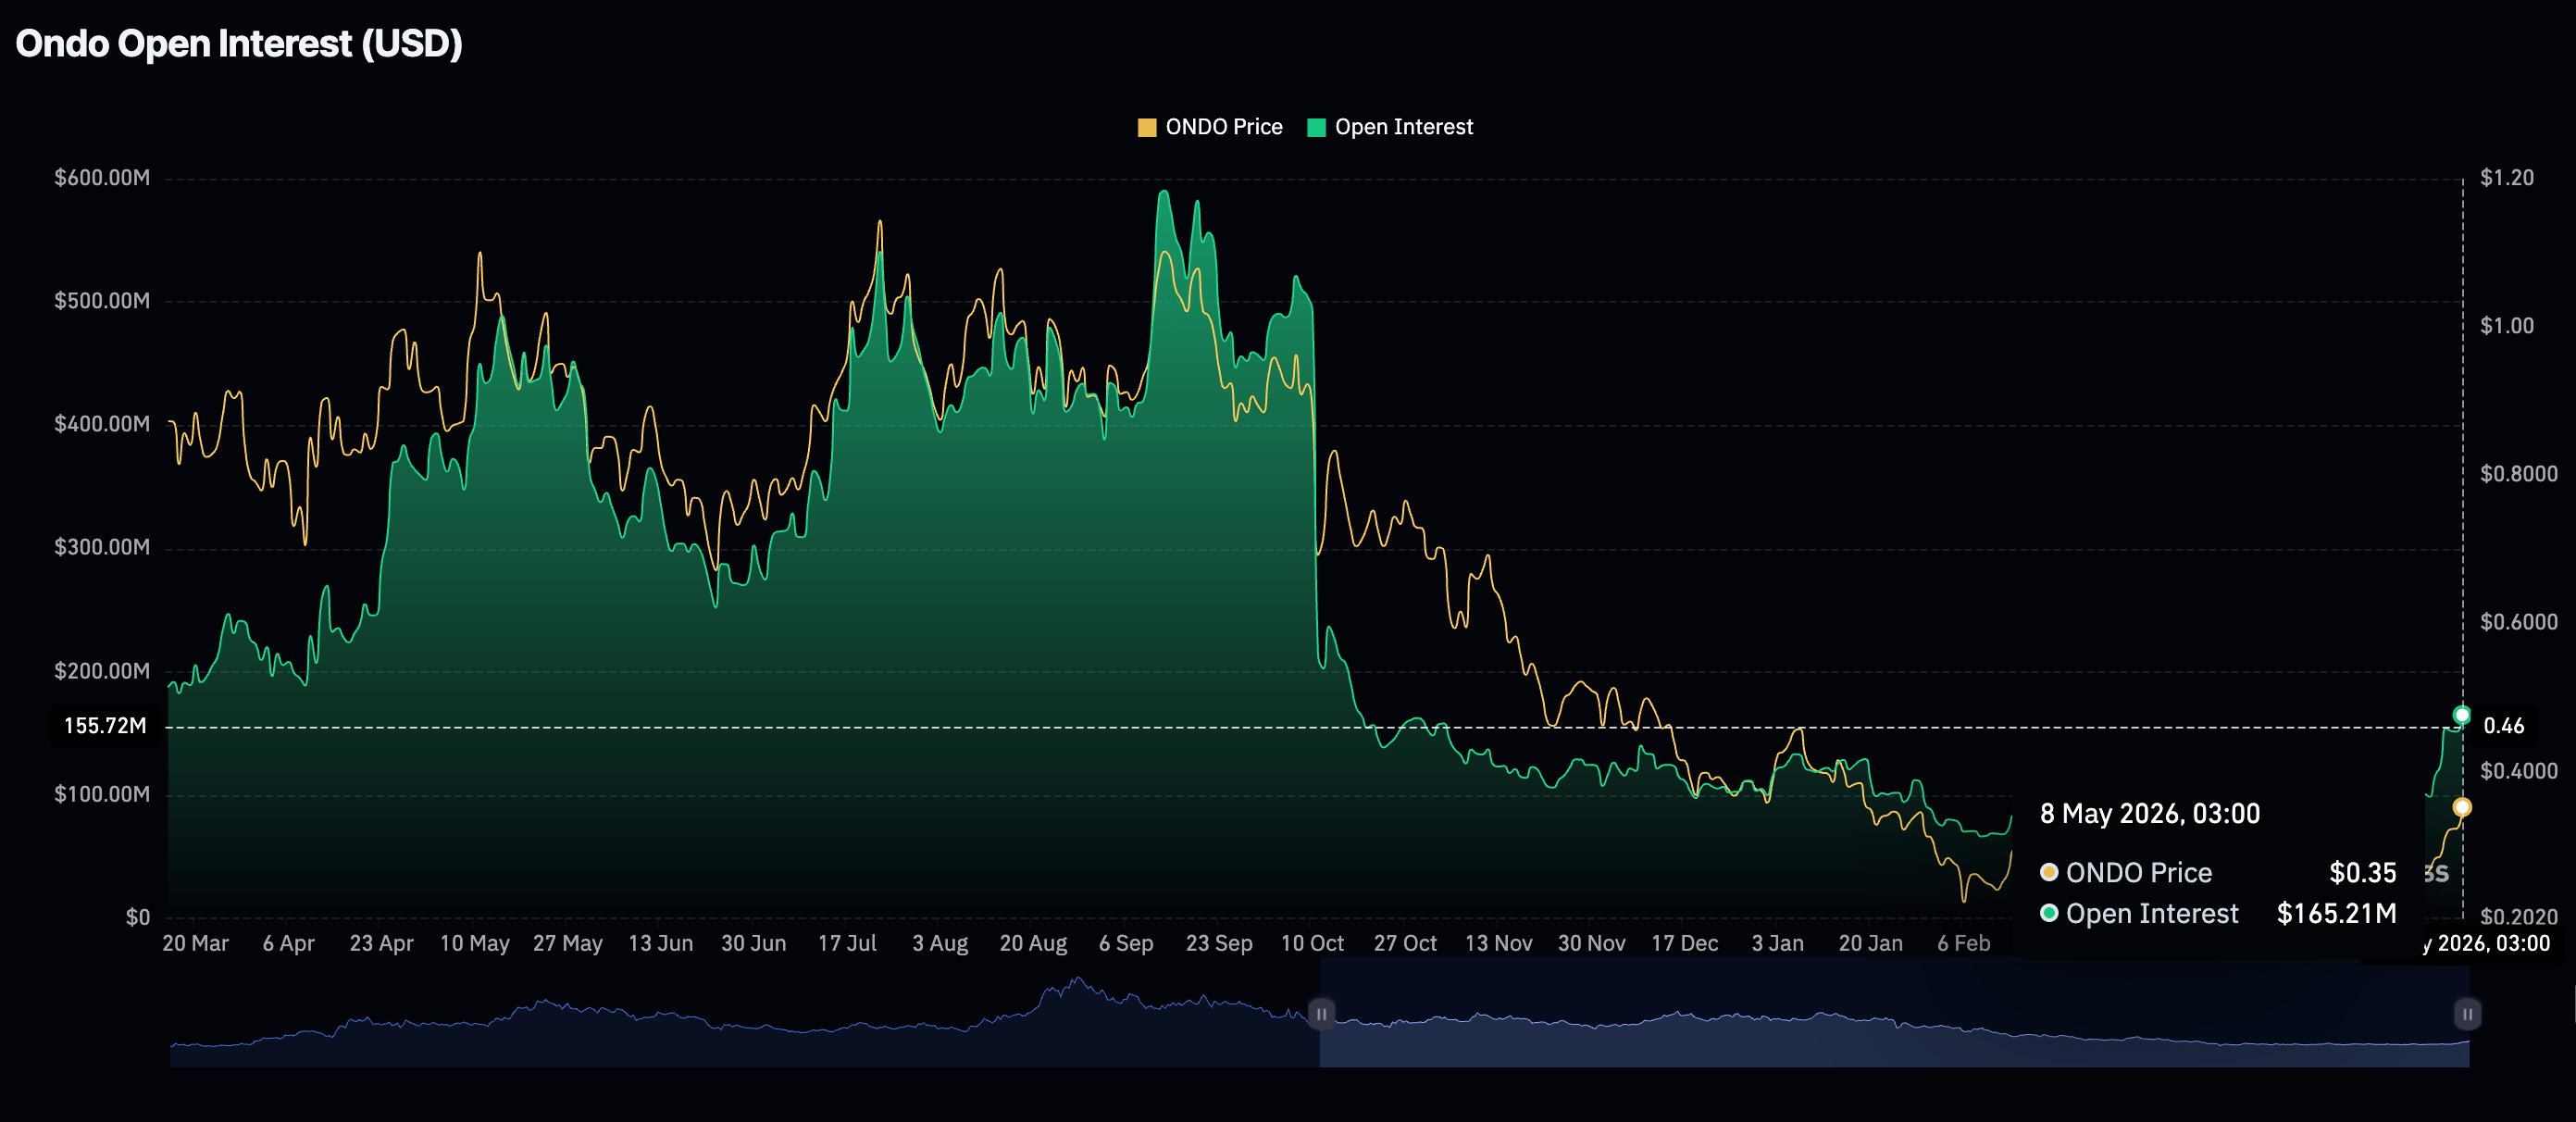
- Ondo traders increasingly pile into long positions as futures Open Interest climbs to $165 million.
- Ondo rally is underpinned by robust technical momentum, highlighted by a bullish MACD crossover and a steadily rising RSI.

Ondo (ONDO) is extending its rally above $0.4000 at the time of writing on Friday, underpinned by growing interest in the token, following news of the network launching the first-ever tokenized Treasury bill settlement.
The cross-border, interbank settlement of tokenized short-term US Treasuries was piloted by Ondo Finance in collaboration with JPMorgan, Mastercard and Ripple. It spearheads the expansion and tokenization of Treasury bill settlement into a regulated on-chain environment, away from permissionless blockchains such as BlackRock’s BUIDL.
Ondo attracts strong market interest
Retail investors are increasingly seeking exposure to Ondo derivatives, as reflected by the perpetual futures Open Interest (OI) rising to $165 million on Friday, from nearly $152 million the previous day.
The surge in retail interest suggests strong conviction in Ondo’s short-term bullish outlook as traders open new positions. However, a sustained increase in OI as prices rise also implies highly leveraged positions, which could lead to cascading liquidations should Ondo encounter strong resistance.
Technical outlook: Ondo gains momentum as pressure eases
Ondo trades at $0.4052, holding firmly above its key Exponential Moving Averages (EMAs), with the 200-day EMA at $0.4008 and the 100-day EMA near $0.3020, reinforcing a clear bullish near-term bias following the latest breakout.
The SuperTrend line around $0.2940 also trails well below the spot price, while the Relative Strength Index (RSI) at 89 signals extreme overbought conditions, hinting that upside momentum is strong but increasingly stretched.
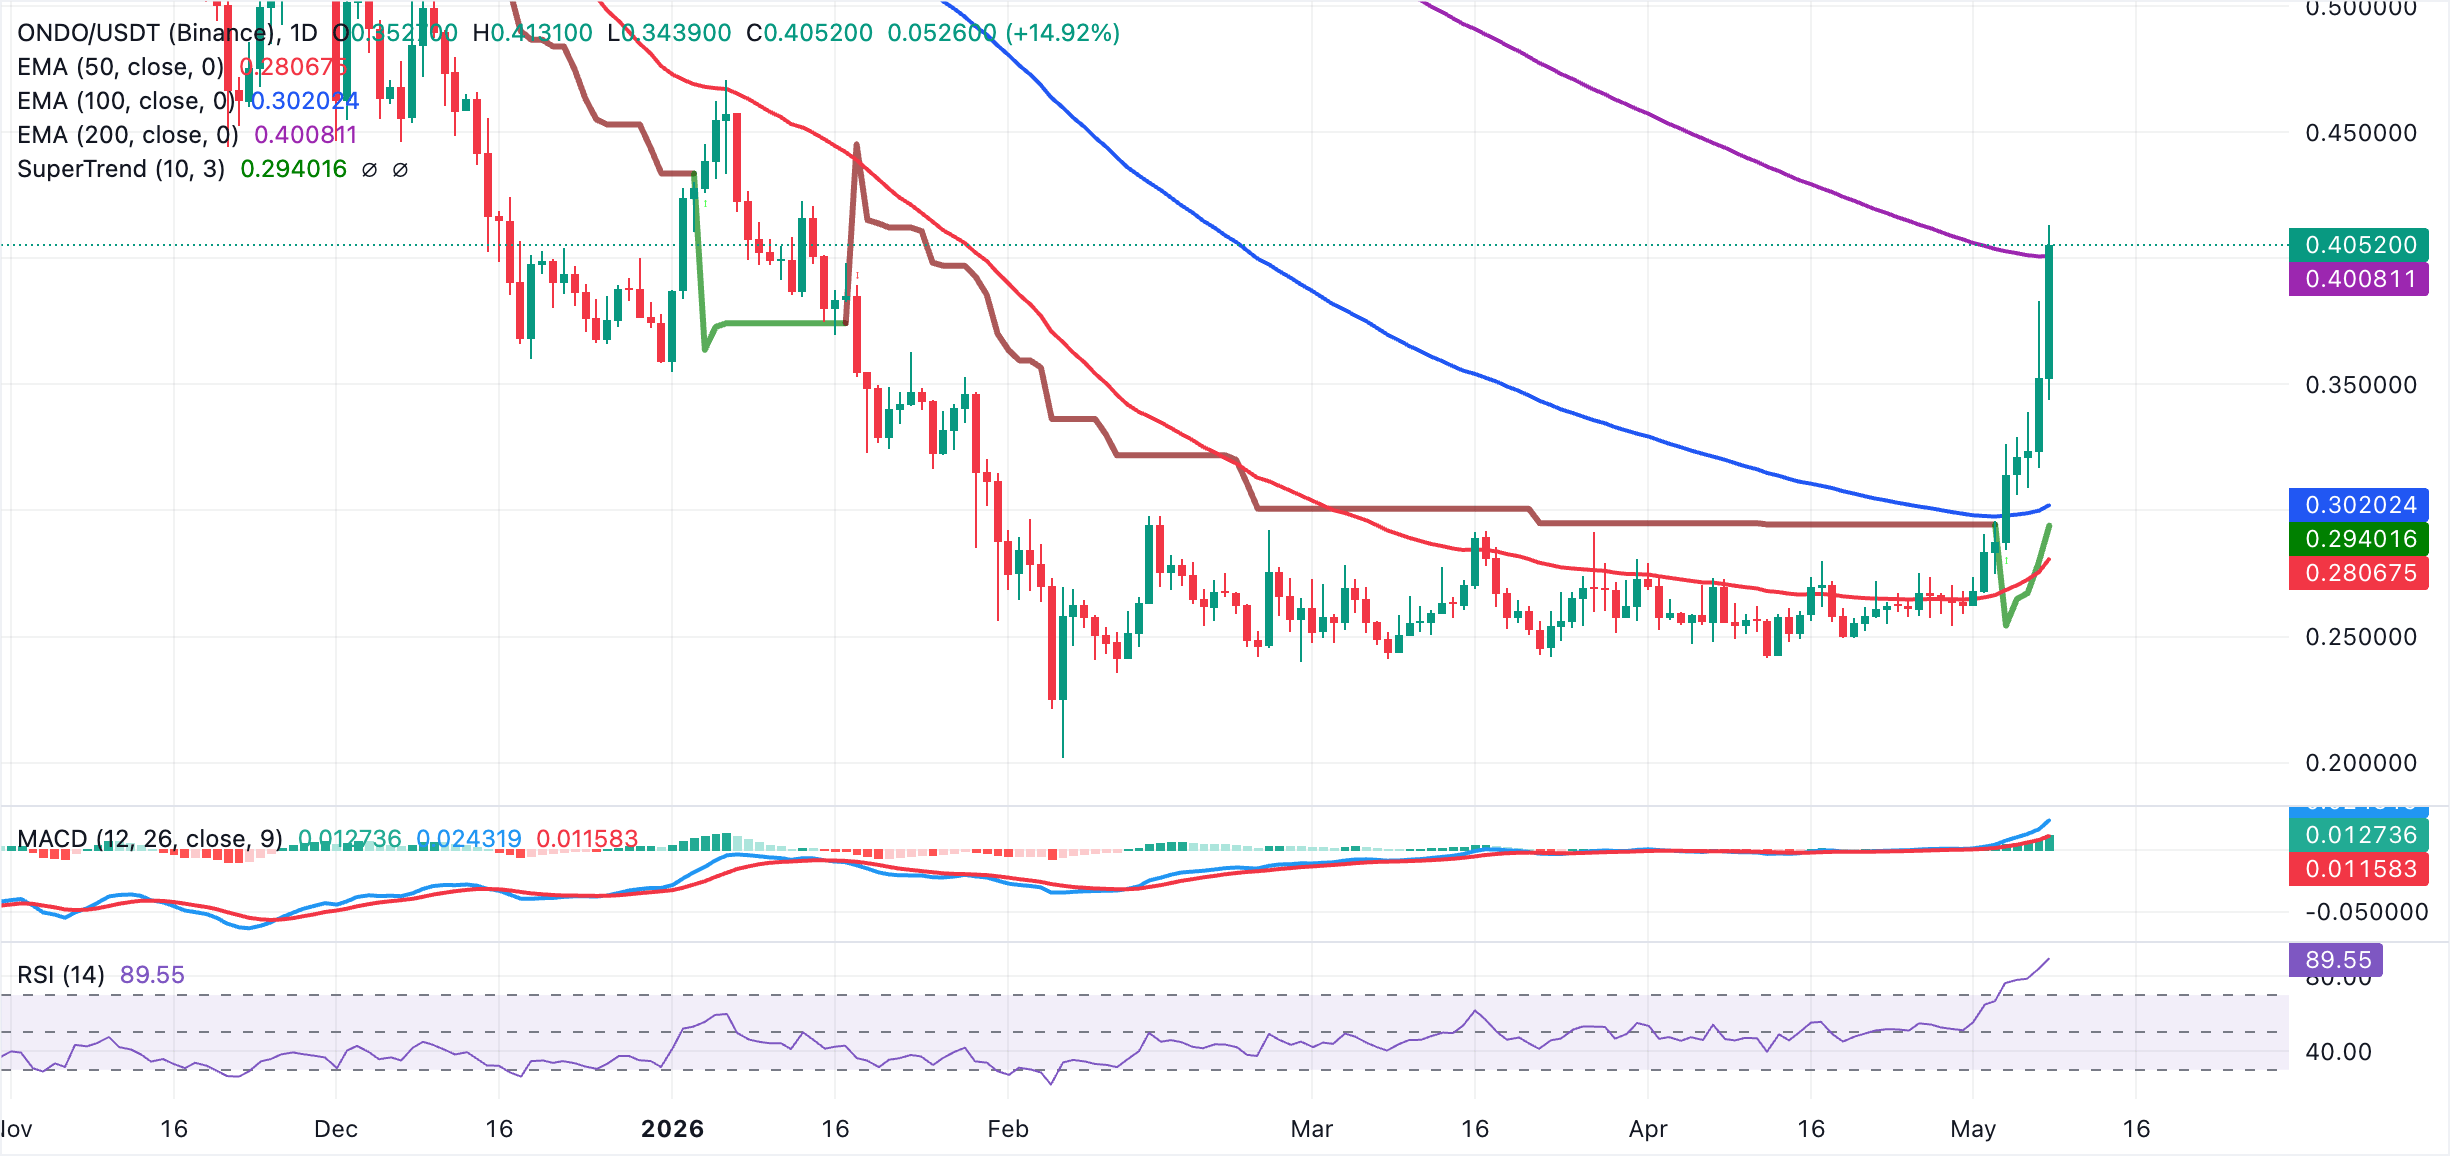
On the downside, initial dynamic support aligns with the 200-day EMA at $0.4008, with deeper backing from the 100-day EMA at roughly $0.3020 and the SuperTrend level near $0.2940. A more substantial corrective phase would likely look toward the 50-day EMA around $0.2807, where buyers could attempt to reassert the broader uptrend if profit-taking intensifies. A sustained rally above the demand around $0.4000 could increase the odds of a breakout past the next key barrier at $0.4500.
(The technical analysis of this story was written with the help of an AI tool.)
Open Interest, funding rate FAQs
Higher Open Interest is associated with higher liquidity and new capital inflow to the market. This is considered the equivalent of increase in efficiency and the ongoing trend continues. When Open Interest decreases, it is considered a sign of liquidation in the market, investors are leaving and the overall demand for an asset is on a decline, fueling a bearish sentiment among investors.
Funding fees bridge the difference between spot prices and prices of futures contracts of an asset by increasing liquidation risks faced by traders. A consistently high and positive funding rate implies there is a bullish sentiment among market participants and there is an expectation of a price hike. A consistently negative funding rate for an asset implies a bearish sentiment, indicating that traders expect the cryptocurrency’s price to fall and a bearish trend reversal is likely to occur.
Author

John Isige
FXStreet
John Isige is a seasoned cryptocurrency journalist and markets analyst committed to delivering high-quality, actionable insights tailored to traders, investors, and crypto enthusiasts. He enjoys deep dives into emerging Web3 tren



