Litecoin poised for double-digit decline after breaking ascending trendline
- Litecoin breaks and closes below an ascending trendline, signaling a change in market structure.
- On-chain metrics paint a bearish picture, as LTC’s dormant wallets are active, and the NPL indicator shows a negative spike.
- A daily candlestick close above $71.25 would invalidate the bearish thesis.

Litecoin (LTC) trades slightly down at around $66.60 on Monday after closing below an ascending trendline on Sunday. Technical indicators suggest a potential downturn, supported by on-chain metrics showing dormant wallets becoming active and a negative spike in the Network Realized Profit/Loss (NPL) indicator pointing to a decline ahead.
Litecoin set for a down leg after closing below an upward trendline
Litecoin price broke and closed below an ascending trendline (drawn by joining multiple lows since early August) on Sunday after facing rejection and closing below the 200-day Exponential Moving Average (EMA) at $70.63 earlier in the week. As of Monday, LTC’s price continues to trade down around $66.60.
If the ascending trendline breakdown level around $68 holds as resistance, LTC could decline over 11% from its current level to retest its August 27 low of $59.
The Relative Strength Index (RSI) on the daily chart points downwards and reads at 43, below its neutral level of 50, indicating increasing bearish momentum.
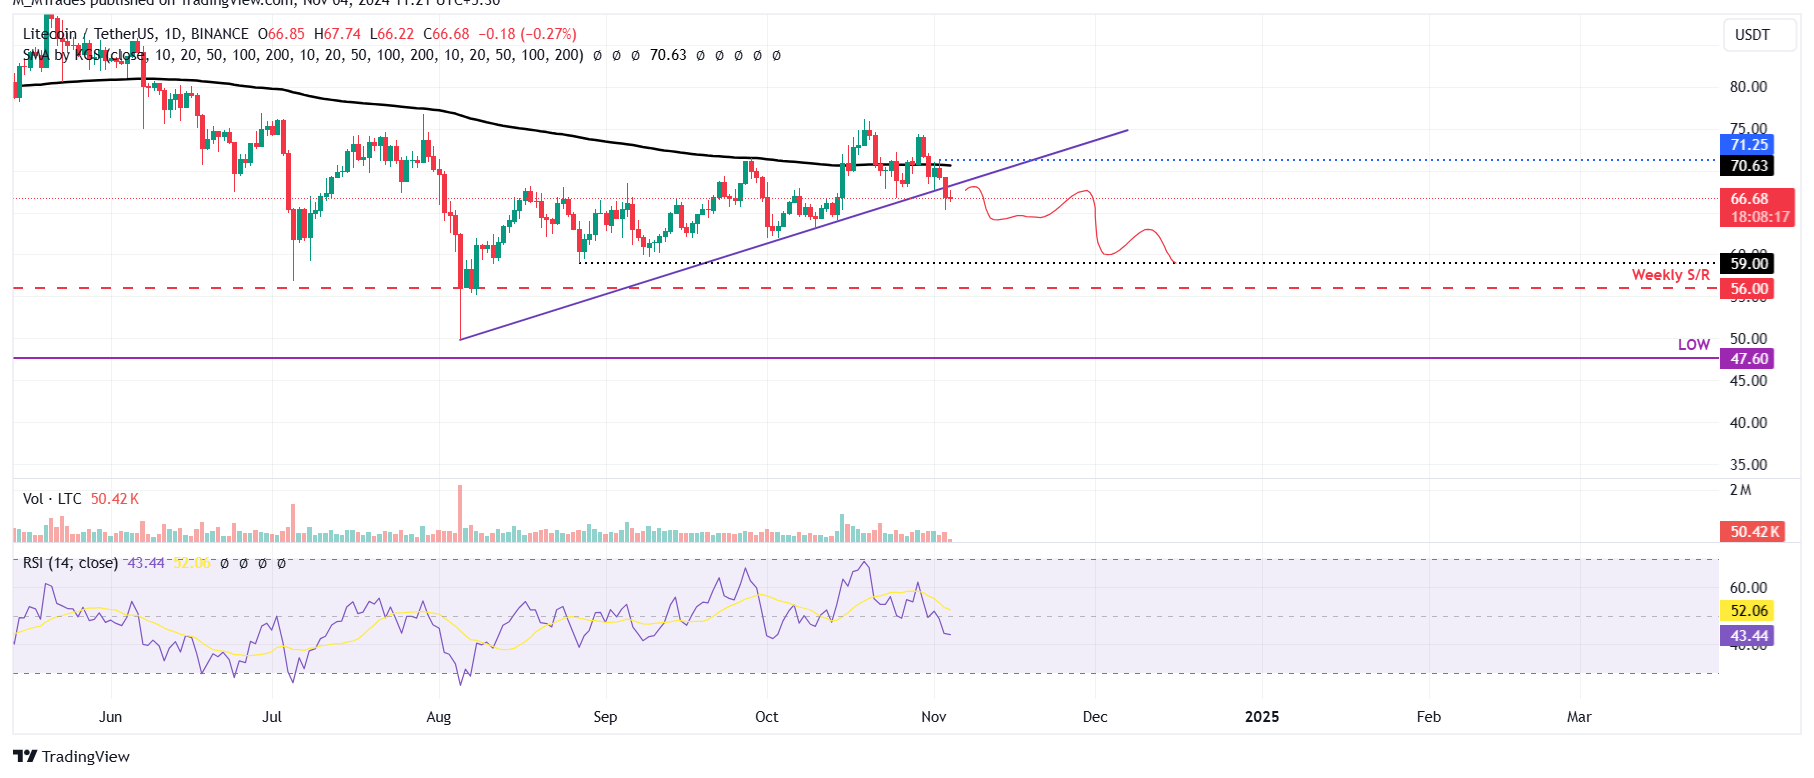
LTC/USDT daily chart
Santiment’s Age Consumed index aligns with the bearish outlook noted from the technical perspective. Spikes in this index suggest dormant tokens (tokens stored in wallets for a long time) are in motion, and they can be used to spot short-term local tops or bottoms.
For LTC, history shows that the spikes were followed by a decline in Litecoin price. The most recent uptick on Saturday also forecasted that LTC was ready for a downtrend.
%20[11.01.41,%2004%20Nov,%202024]-638663015968228375.png)
LTC Age Consumed chart. Source: Santiment
Santiment’s Network Realized Profit/Loss (NPL) indicator also projects a bearish outlook. This metric shows daily network-level Return On Investment (ROI) based on the coin’s on-chain transaction volume. Strong spikes in a coin’s NPL indicate that its holders are, on average, selling their bags at a significant profit. On the other hand, strong dips imply that the coin’s holders are, on average, realizing losses, suggesting panic sell-offs and investor capitulation.
In LTC’s case, the NPL indicator dipped from -649,360 to -65.54 million from Friday to Saturday.This negative downtick indicates that the holders were, on average, realizing losses and increasing the selling pressure.
%20[11.02.52,%2004%20Nov,%202024]-638663016360882016.png)
LTC Network Realized Profit/Loss chart. Source: Santiment
However, if LTC recovers the 200-day EMA at $70.63 and closes above Saturday’s high of $71.25, the bearish thesis would be invalidated. This scenario would cause the Litecoin price to rise 7% to retest its October 19 high of $76.19.
Author

Manish Chhetri
FXStreet
Manish Chhetri is a crypto specialist with over four years of experience in the cryptocurrency industry.


