LayerZero Price Forecast: ZRO holds gains as MoonPay integration sparks bullish futures interest
- LayerZero edges 3% lower on Tuesday after a 14% rebound the previous day.
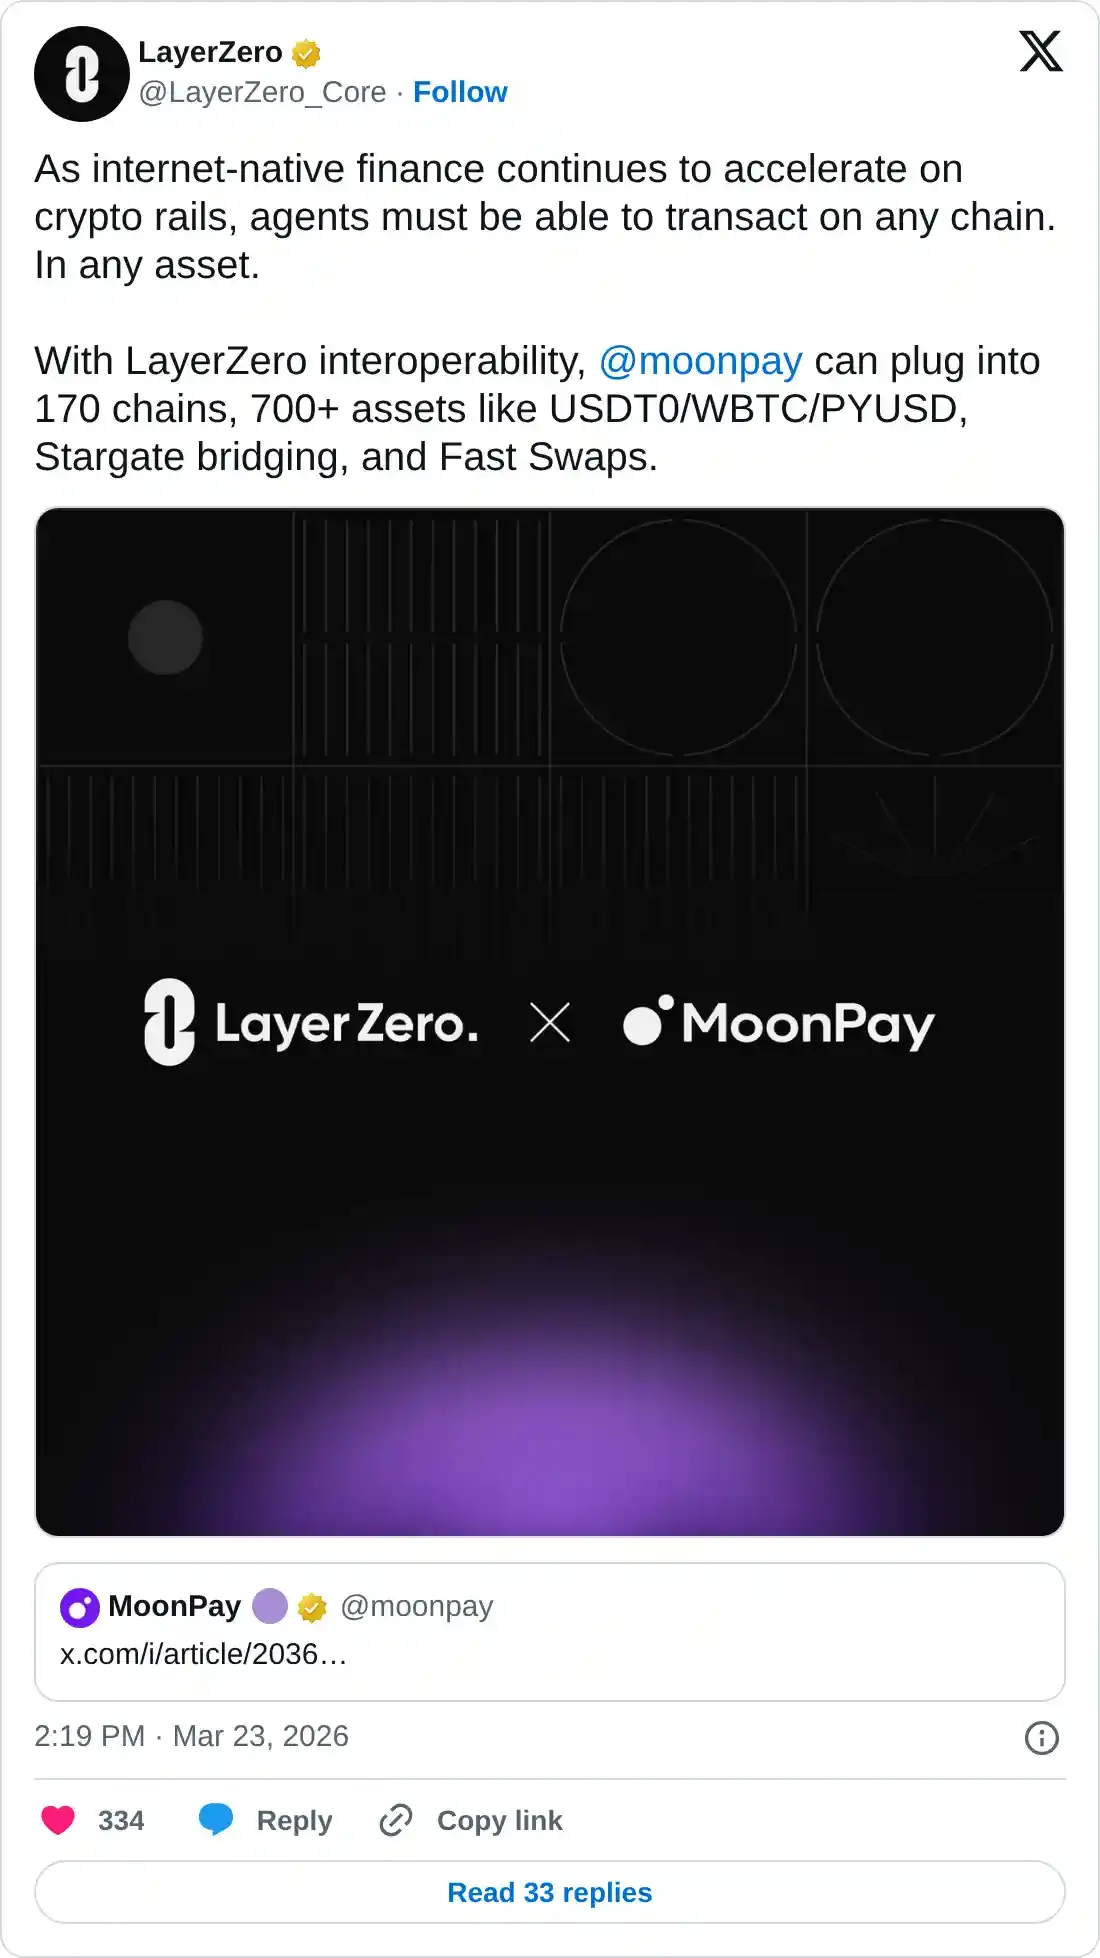
- LayerZero integrates MoonPay’s Open Wallet Standard to enable cross-chain, autonomous AI-agentic payments.
- Derivatives data shows a 17% rise in ZRO futures Open Interest over the last 24 hours, signaling bullish interest.

LayerZero (ZRO) retraces by 3% at press time on Tuesday, following an over 14% rebound the previous day. The partnership of LayerZero protocol and MoonPay’s Open Wallet Standard (OWS) could scale Artificial Intelligence (AI) agent-driven commerce across multiple blockchains. A 17% hike in ZRO futures Open Interest over the last 24 hours suggests an uplift in investors' confidence.
LayerZero x MoonPay: Integration to boost agentic economy lifts retail interest
The partnership between the LayerZero protocol and MoonPay’s OWS will enable AI payments across 170 blockchains, supporting multiple assets, including USDT0, WBTC, and PYUSD, with minimal latency. This could foster the adoption of decentralized tools for high-frequency payments.
The retail demand for LayerZero increases amid the new integration. CoinGlass data shows a 17% increase in ZRO Open Interest (OI) to $135.59 million over the last 24 hours, reflecting a rise in the notional value of outstanding ZRO contracts. Amid this positional buildup, the total liquidations amount to $88,450 over the last 24 hours, led by $71,670 of short liquidations, suggesting a larger wipeout of bearish positions.

Technical outlook: Will ZRO price extend recovery for a breakout rally?
LayerZero is down 3% at press time on Tuesday, retracing after the 14% rebound on the previous day. Despite the pullback, ZRO holds above the 50-day Exponential Moving Average at 1.90, which marks a Golden Cross with the 200-day Exponential Moving Average, reflecting a broader bullish bias.
However, the Moving Average Convergence Divergence (MACD) rises toward its signal line after the recent bearish crossover, as bearish momentum wanes. A potential crossover between the MACD and the signal line would confirm renewed bullish momentum. The Relative Strength Index (RSI) at 56 bounces off the midline, reflecting attempts to hold upside momentum.
On the upside, immediate resistance sits around $2.39, marked by the January 23 high, and a daily close above this cap would reassert bullish control and open the way toward $2.59, last tested on February 11.
(The technical analysis of this story was written with the help of an AI tool.)
Author

Vishal Dixit
FXStreet
Vishal Dixit holds a B.Sc. in Chemistry from Wilson College but found his true calling in the world of crypto.



