Hyperliquid Price Forecast: HYPE poised to extend gains as US-Iran ceasefire boosts risk appetite
- Hyperliquid extends gains on Wednesday after a 6% jump the previous day, linked to the US-Iran ceasefire.
- HYPE futures Open Interest jumps 9% in 24 hours, signaling renewed risk appetite.
- The technical outlook is bullish as HYPE breaks above a falling channel pattern, targeting $41.

Hyperliquid (HYPE) approaches $40 at press time on Wednesday, extending the US-Iran ceasefire-linked recovery. Retail demand for HYPE is rising, leading to elevated futures Open Interest amid improved broader market sentiment. Technically, HYPE breaks out of a falling channel pattern on the 4-hour chart, suggesting a near-term bullish outlook.
Broader market risk-on sentiment fuels demand for the everything exchange token
Hyperliquid stayed resilient throughout the US-Iran war as its platform provides a 24/7 trading window for crude oil and other commodities that gained traction during the war. The ceasefire-linked recovery in the crypto market is heightening anticipation for HYPE’s recovery.
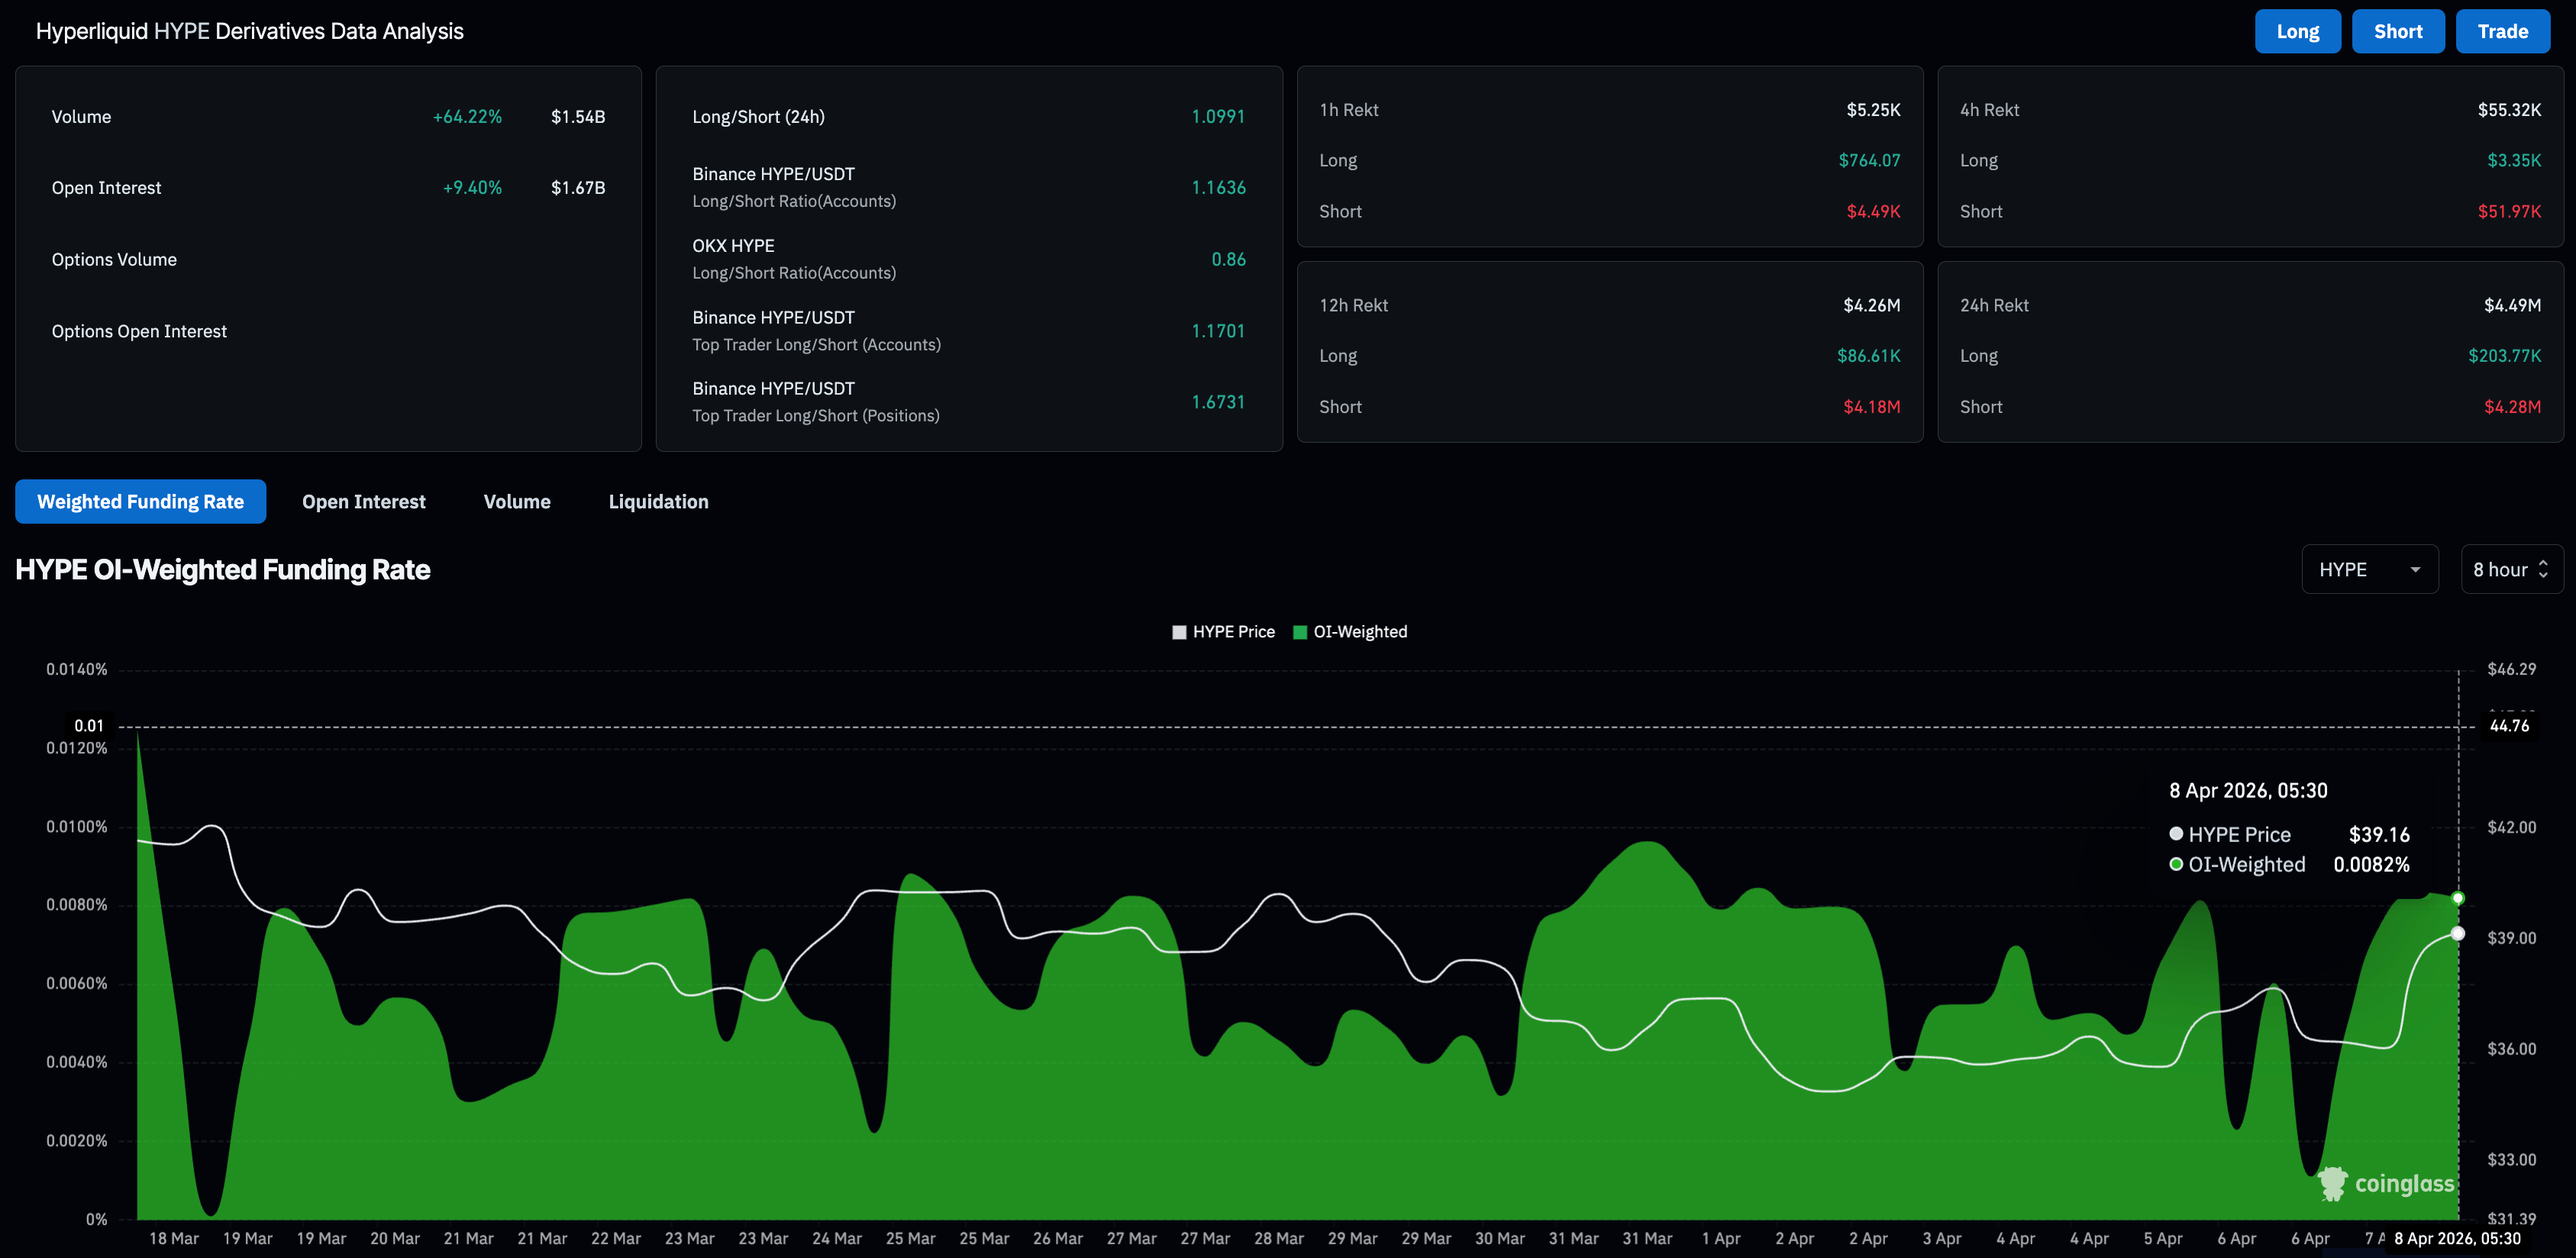
CoinGlass data shows the HYPE futures Open Interest (OI) stands at $1.67 billion on Wednesday, up over 9% in the last 24 hours. Typically, an OI expansion during a spot market recovery signals latent demand entering the leverage market.
Liquidations over the last 24 hours totaled $4.49 million, led by $4.28 million in shorts, reflecting a sell-side weakness. Additionally, the OI-weighted funding rate remains positive at 0.0082%, reflecting the consistent bullish tilt in the traders' sentiment.
Technical outlook: Will HYPE cross above $40?
Hyperliquid recovery crosses above the 50- and 200-period Exponential Moving Averages (EMAs) on the 4-hour chart, reflecting a potential trend reversal. At the time of writing, HYPE trades around $39.00, extending the breakout gains of a falling channel pattern (see chart below).
HYPE tests the 50% retracement level of the $43.72 to $34.45 slide at $38.81. A decisive close above this level would put the 78.6% Fibonacci retracement level at $41.55 in the range, followed by the March 18 high at $43.72.
The Moving Average Convergence Divergence (MACD) line is above its signal and the zero line, with a positive histogram suggesting strengthening upside momentum. The Relative Strength Index (RSI) at 68 remains below overbought territory, suggesting firm buying pressure without clear exhaustion at this stage.
Looking down, a reversal in HYPE could test the 200-period EMA at $37.10, close to the broken descending trendline zone. A drop below this zone would nullify the channel breakout and deepen the downside risk.
(The technical analysis of this story was written with the help of an AI tool.)
Author

Vishal Dixit
FXStreet
Vishal Dixit holds a B.Sc. in Chemistry from Wilson College but found his true calling in the world of crypto.



