Hyperliquid Price Forecast: HYPE eyes the next big move on record high Open Interest
- Hyperliquid hovers around $57 on Friday after hitting a record high of $62.58 the previous day.
- Record high Open Interest and positive funding rates imply strong retail demand.
- The technical outlook is cautiously bullish, as buying pressure pushes into overbought territory.

Hyperliquid (HYPE) edges lower at press time on Friday after a five-day rally, which hit a record high of $62.58 on Thursday. Retail sentiment shows signs of extreme bullishness, with HYPE futures Open Interest (OI) and Real World Assets (RWAs) trading at all-time highs. Hyperliquid should secure a daily close above $60 to sustain a rally, potentially toward $80.
The HYPE is real
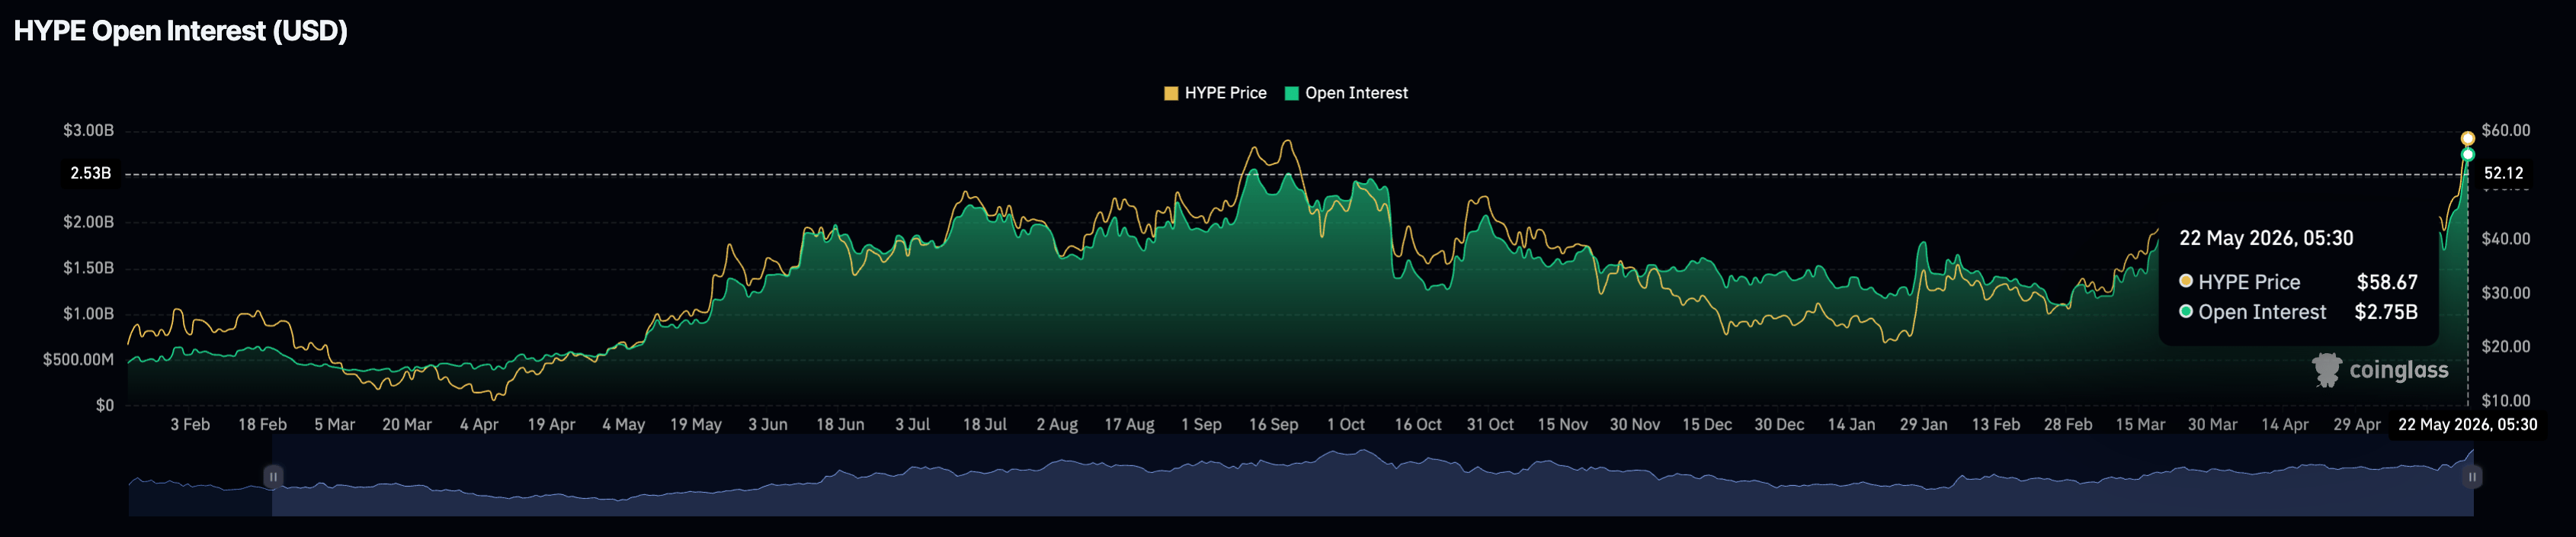
Hyperliquid futures trading activity is at an all-time high as record-high spot prices fuel retail participation. CoinGlass data shows the HYPE OI stands at $2.75 billion on Friday, up from $1.56 billion on May 1. The positional buildup has surpassed the $2.59 billion high set on September 12, suggesting leverage-driven upside anticipation.
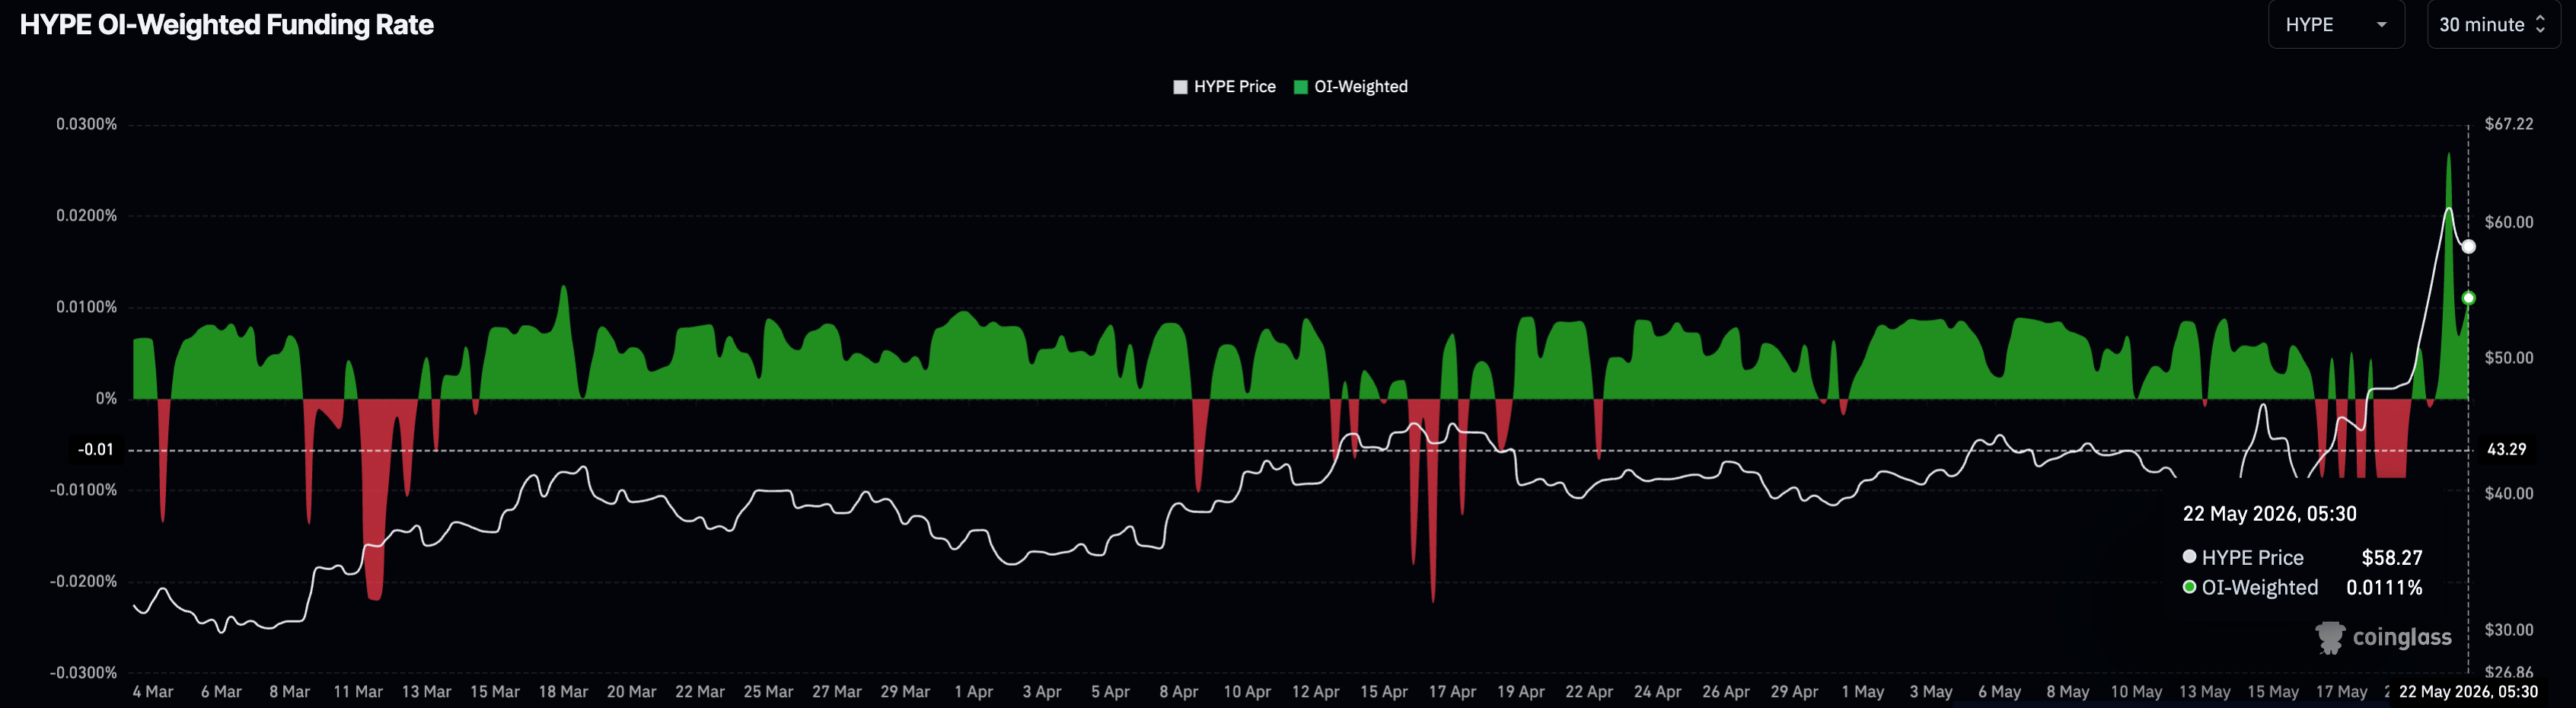
At the same time, the OI-weighted funding rate is at 0.011% on Friday, holding above the zero line but down from the 0.027% peak the previous day. Typically, higher funding rates reflect higher demand from buyers to build long positional setups, even at a premium.
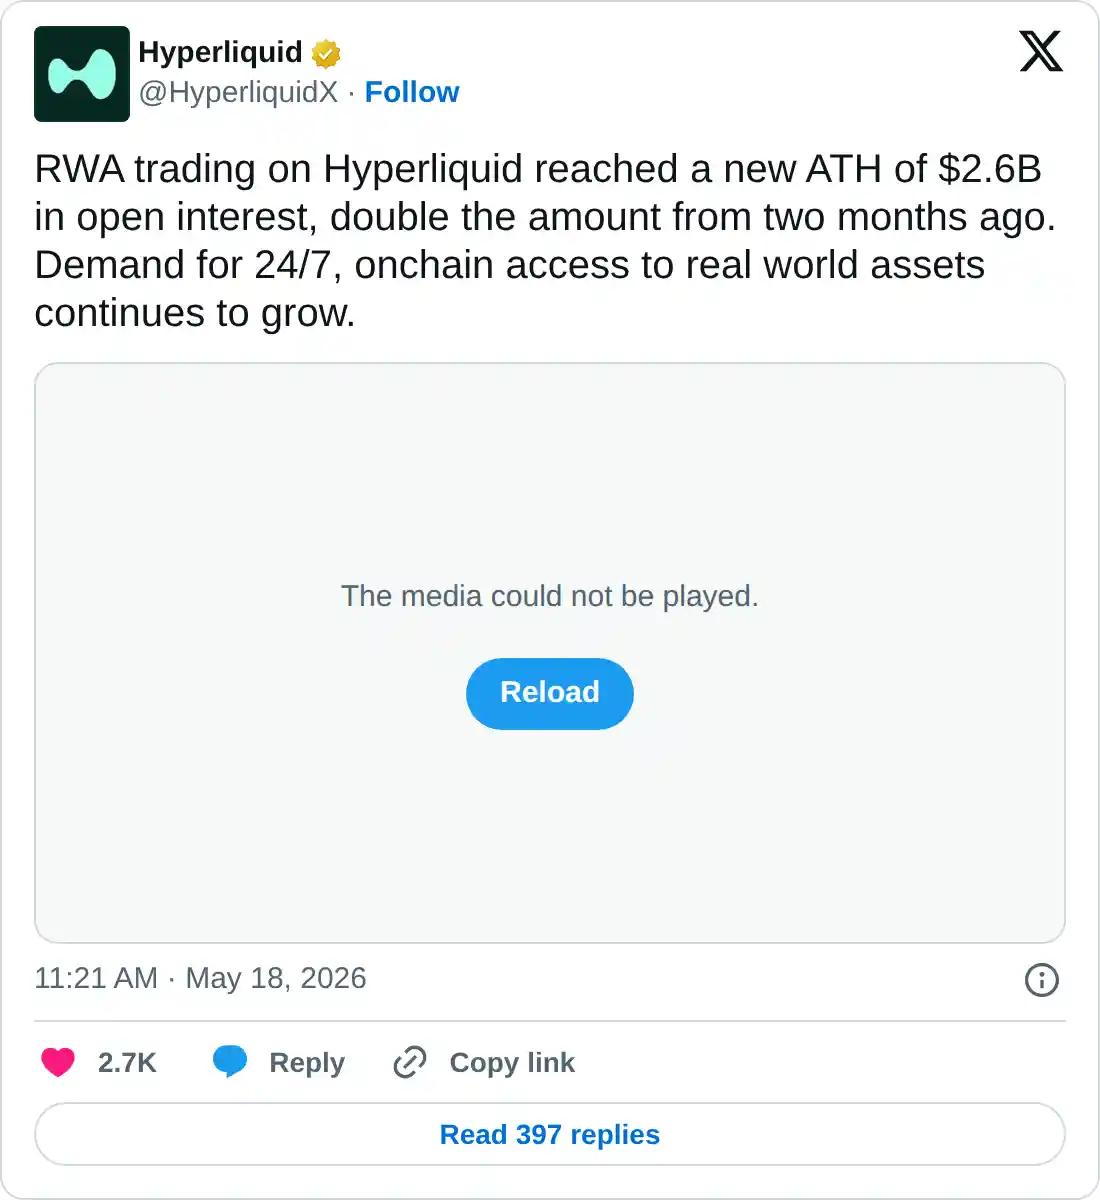
On the other hand, the decentralized everything exchange hit a record high in RWA trading activity, with $2.6 billion OI, implying its growing market share in the traditional market.
Will Hyperliquid cross $100?
Hyperliquid trades around $57.58 at press time on Friday, keeping a broadly bullish bias. HYPE holds well above both the 50-day Exponential Moving Average (EMA) at $43.10 and the 200-day EMA at $37.18.
The rally is now approaching the prior swing high region from September 18 at $59.45, acting as the next upside cap. A decisive close above this level would confirm a bullish breakout, scaling HYPE into a price discovery mode. The 127.2% and 161.8% Fibonacci extension levels at $79.40 and $114.75, measured from the $59.45 to $20.51 downswing, serve as the next key price targets.
Momentum remains strong, with the Relative Strength Index (RSI) at 75 on the daily chart suggesting overbought conditions, while Moving Average Convergence Divergence (MACD) stays positive and above its signal line, hinting that bullish pressure is still in control even as risks of a corrective pause increase.
On the downside, initial support is seen at the trendline breakout area near $53.00, followed by the 78.6% Fibonacci retracement at $51.12, where a pullback could find early demand. Below that zone, the rising 50-day EMA at $43.10 to build a more substantial support area, ahead of the prior breakout region around the 50% retracement at $39.98.
(The technical analysis of this story was written with the help of an AI tool.)
Author

Vishal Dixit
FXStreet
Vishal Dixit holds a B.Sc. in Chemistry from Wilson College but found his true calling in the world of crypto.




