|

Ethereum Price Analysis: ETH/USD bear flag remains a big risk

  • Ethereum price is trading in the green by 0.40% in the session on Tuesday. 
  • ETH/USD is running at two consecutive sessions in the red, after $190 rejection. 
  • Price action remains within the confinements of a bearish flag structure. 
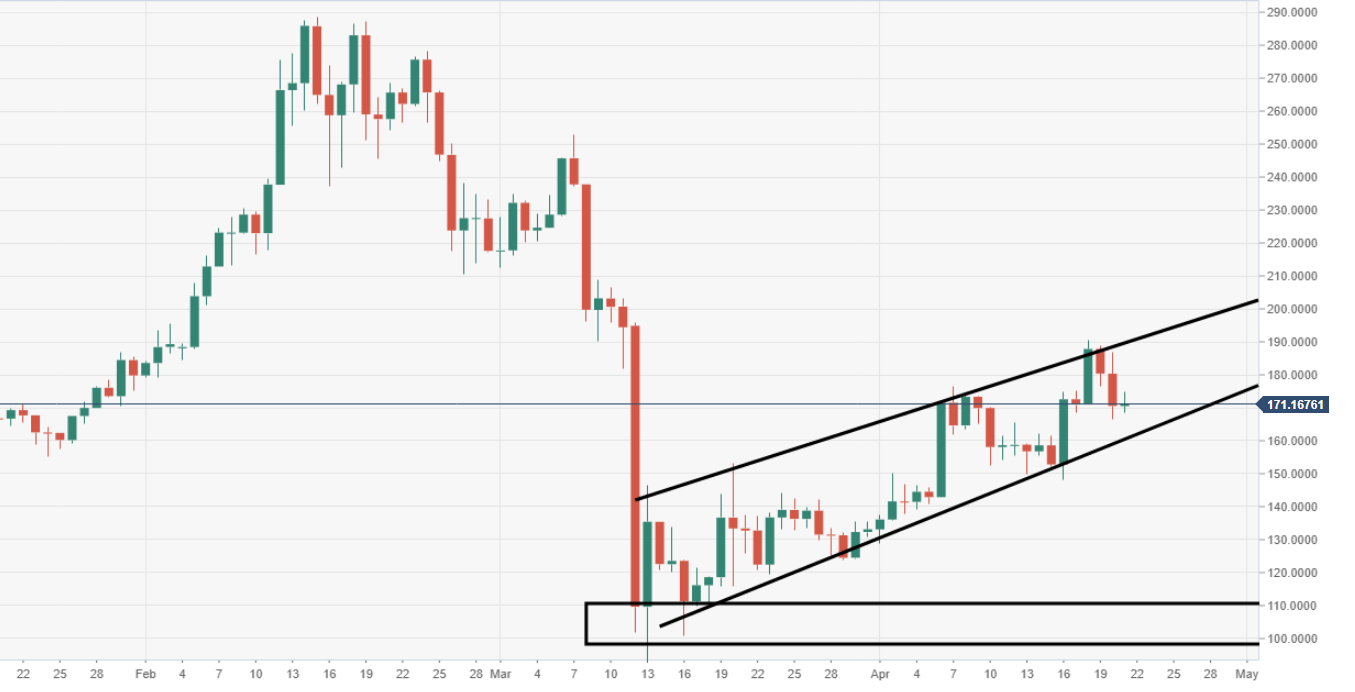
ETH/USD daily chart

The price has been grinding higher since bouncing back from harsh selling in March, forming a flag pattern from 13 March. A breakout south would invite a fresh wave of downside pressure. 

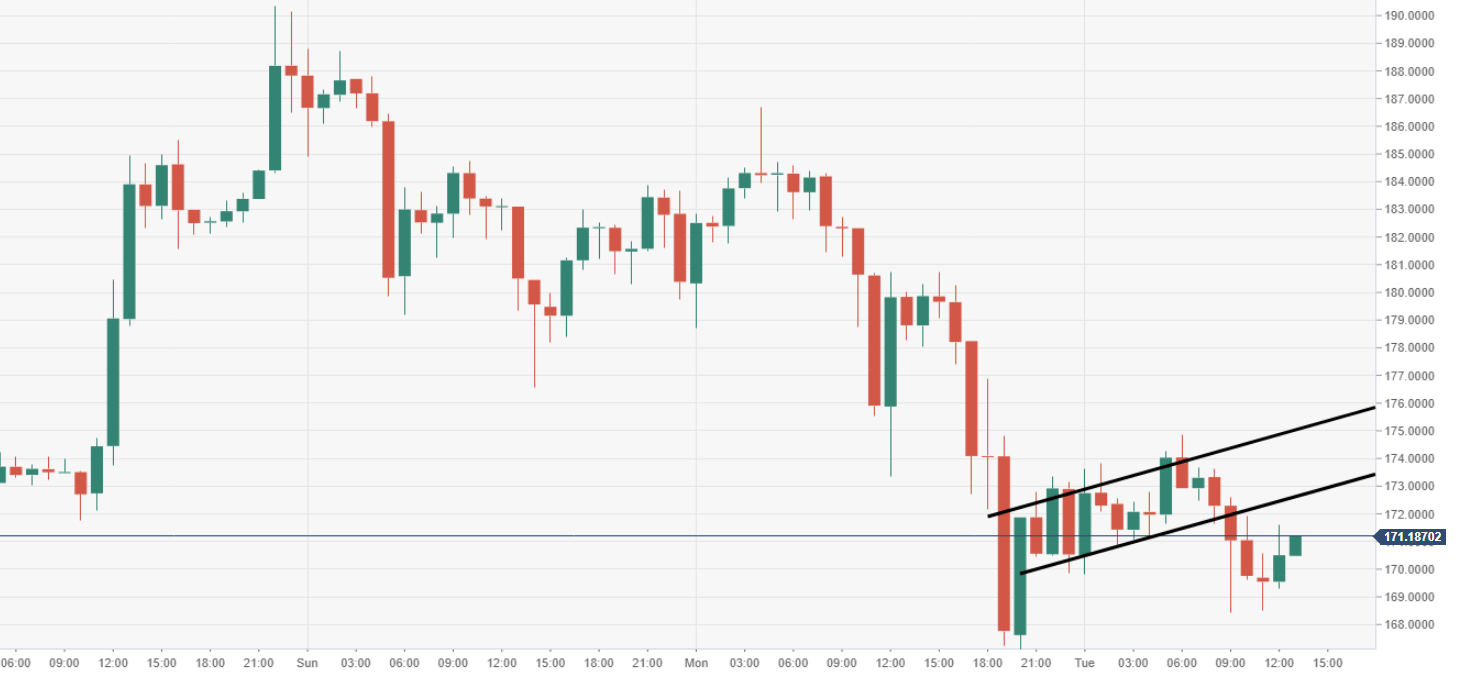
ETH/USD 60-minute chart

A near-term flag is observed via the 60-minute chart, of which the bears have forced a breakout to the downside. 

Spot rate:                      171.32

Relative change:          +0.40%

High:                             174.84

Low:                              168.41

Author

Ken Chigbo

Ken Chigbo

Independent Analyst

Ken has over 8 years exposure to the financial markets. He started his career as an analyst, covering a variety of asset classes; forex, fixed income, commodities and equities.

More from Ken Chigbo
Share:

Editor's Picks

BNB Price Forecast: Correction extends as bearish signals point to deeper losses

BNB, formerly known as Binance Coin, continues to extend its losses, trading below $573 at the time of writing on Friday, losing over 7% so far this week. Muted institutional demand, rising short bets and falling Open Interest signal growing downside bias.

Bitcoin network activity hits new high despite stalled prices — CryptoQuant
Bitcoin's onchain activity has climbed to its strongest level of 2026 even as the top crypto continues to trade under bearish pressure, according to a Thursday report from CryptoQuant. The recovery in network activity is being driven almost entirely by transaction volume rather than higher-value economic transfers.
Cardano Price Forecast: Derivatives and on-chain losses compound bearish trend

Cardano (ADA) remains under pressure, trading below $0.165 and losing over 11% so far this week. Weakening derivatives metrics and deteriorating on-chain data support further correction on ADA. Cardano derivatives metrics support a negative outlook.

Crypto Overview: Bitcoin extends decline amid US-Iran negotiation concerns – BCH, HYPE lead losses
The broader cryptocurrency market feels the weight of strained US-Iran negotiations, pushing Bitcoin (BTC) below $63,000 on Friday. Israeli missile strikes over Lebanon bend the first clause of the peace agreement, raising concerns over the renewed passage through the Strait of Hormuz.
Experts agree: Bitcoin nears bottom, but weak demand raises doubts
Bitcoin (BTC) is trading above $63,000 at the time of writing on Friday after rebounding from the key 200-week Simple Moving Average (SMA) near $62,000, a level widely viewed as key long-term support. The recovery may suggest that Bitcoin has found a floor after a sharp correction that spanned more than a month, but some warning signs persist.