Ethereum nears major low as Elliott Wave count and momentum divergences point to reversal potential

In our April update, we found, using the Elliott Wave Principle (EWP), that Ethereum (ETH) would ideally rally to $2626 before another decline. Meanwhile, we found it had to hold above $1938 to keep the bullish uptrend intact. ETH reached only $2423 on May 6, breached $1938 on June 8, which opened the door to that bigger drop, in this case to as low as $1510 by June 26. So far, so good; see Figure 1 below.
The recent decline since the April 17 high (orange Wave 4) is best counted as a five-wave structure (blue waves i, ii, iii, iv, v), with the final 5th wave subdividing into five smaller (pink) waves. The last fifth of a fifth, etc. wave could have completed this week – pink Wave-5 (W-5) of blue W-v of orange W-5 of gray W-v of green W-c of red W-e of black W-4-- illustrating the fractal nature of financial markets.
Figure 1: short-term Elliott Wave count for ETH with several technical indicators
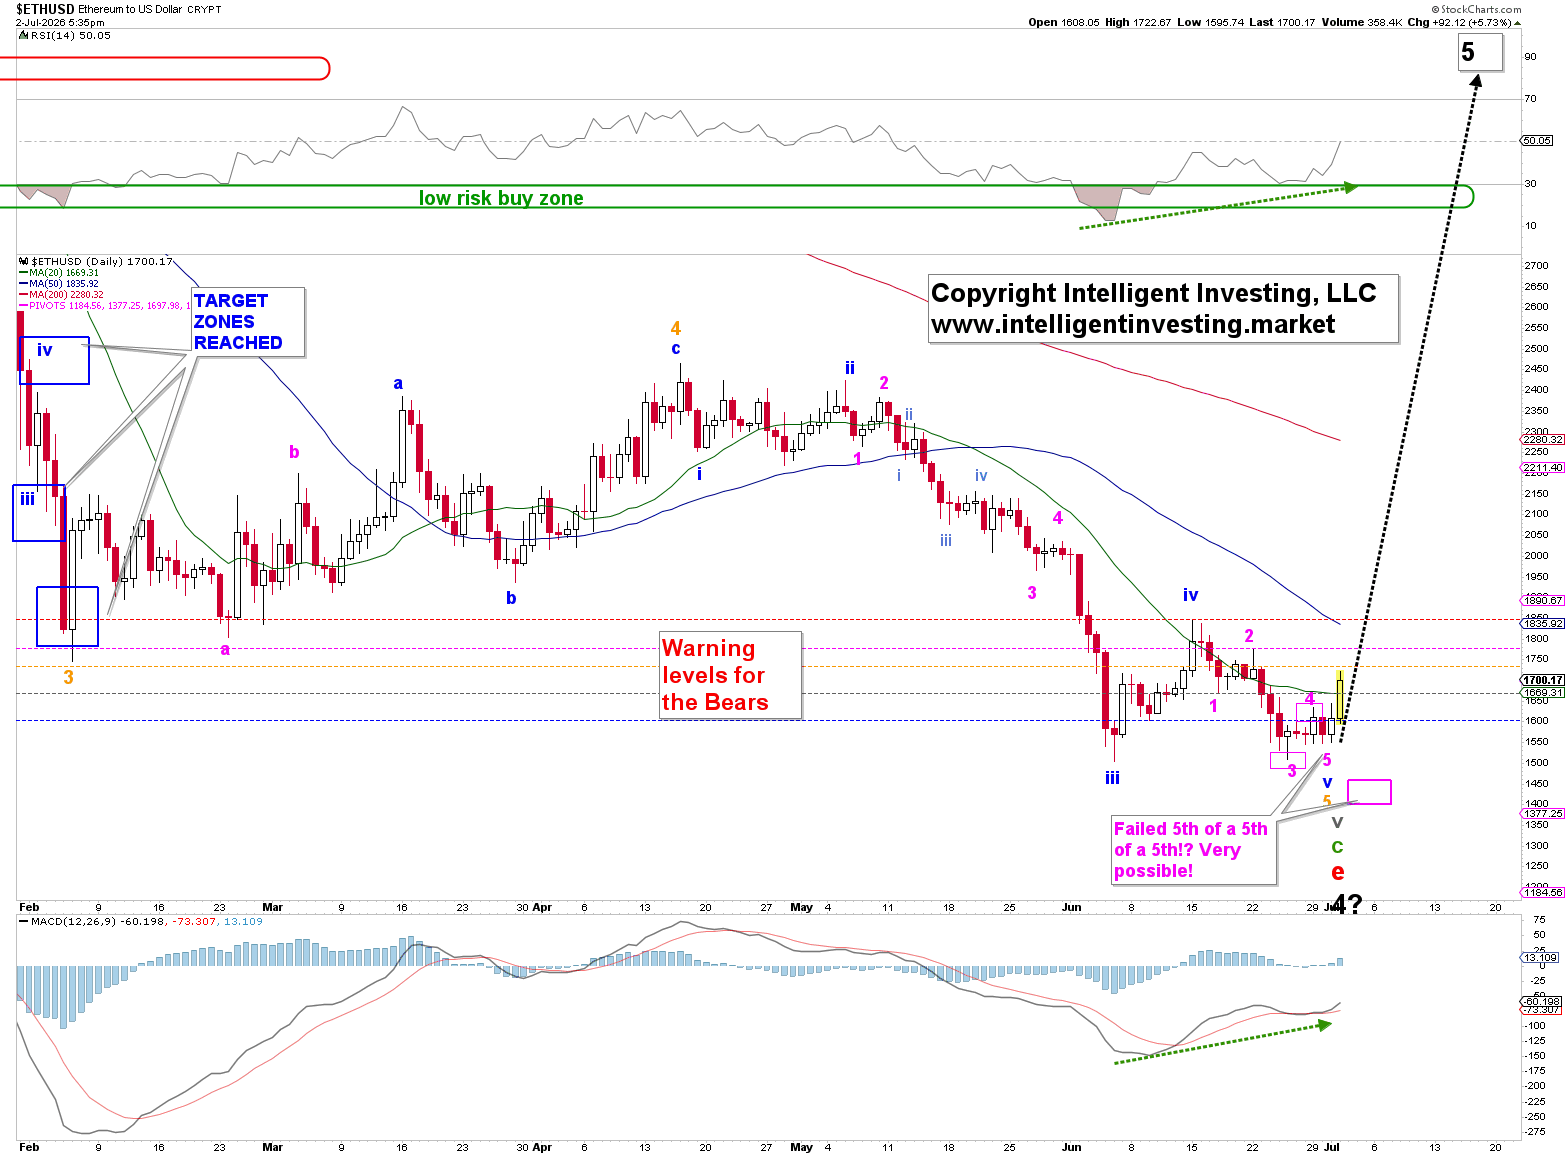
Besides, positive divergences are forming on the daily MACD and RSI5 (green dotted arrows). This is typical at the terminal, i.e., in the 5th wave, as in this case, the downside is losing momentum and strength. Now price needs to confirm this thesis by ultimately breaking back above the blue W-iv high, which peaked on June 15 at $1848, with a serious warning for the Bears on a move above $1777. That is the pink W-2 high made on June 22.
Zooming out, using the monthly time frame, see Figure 2 below, we find that
A) ETH has so far done three larger waves lower from its August 2025 ATH to today’s low (green W-a, b, c), and all corrections comprise at least three waves.
B) ETH’s price sits right at trendline support ($1575+/-25)
C) The monthly RSI is in the “low risk buy zone” (as is the daily, btw), which historically signaled important lows were imminent (2026, 2025, 2019, 2018): black up arrows.
D) ETH’s price has essentially gone sideways for five years, forming a large, potential bull flag pattern
E) The price action since the October 2021 high counts best as an EWP-(ascending) triangle pattern; a-b-c-d-e, as all five legs comprise three (green) waves.
Figure 2. Long-term Elliott Wave count for ETH with several technical indicators
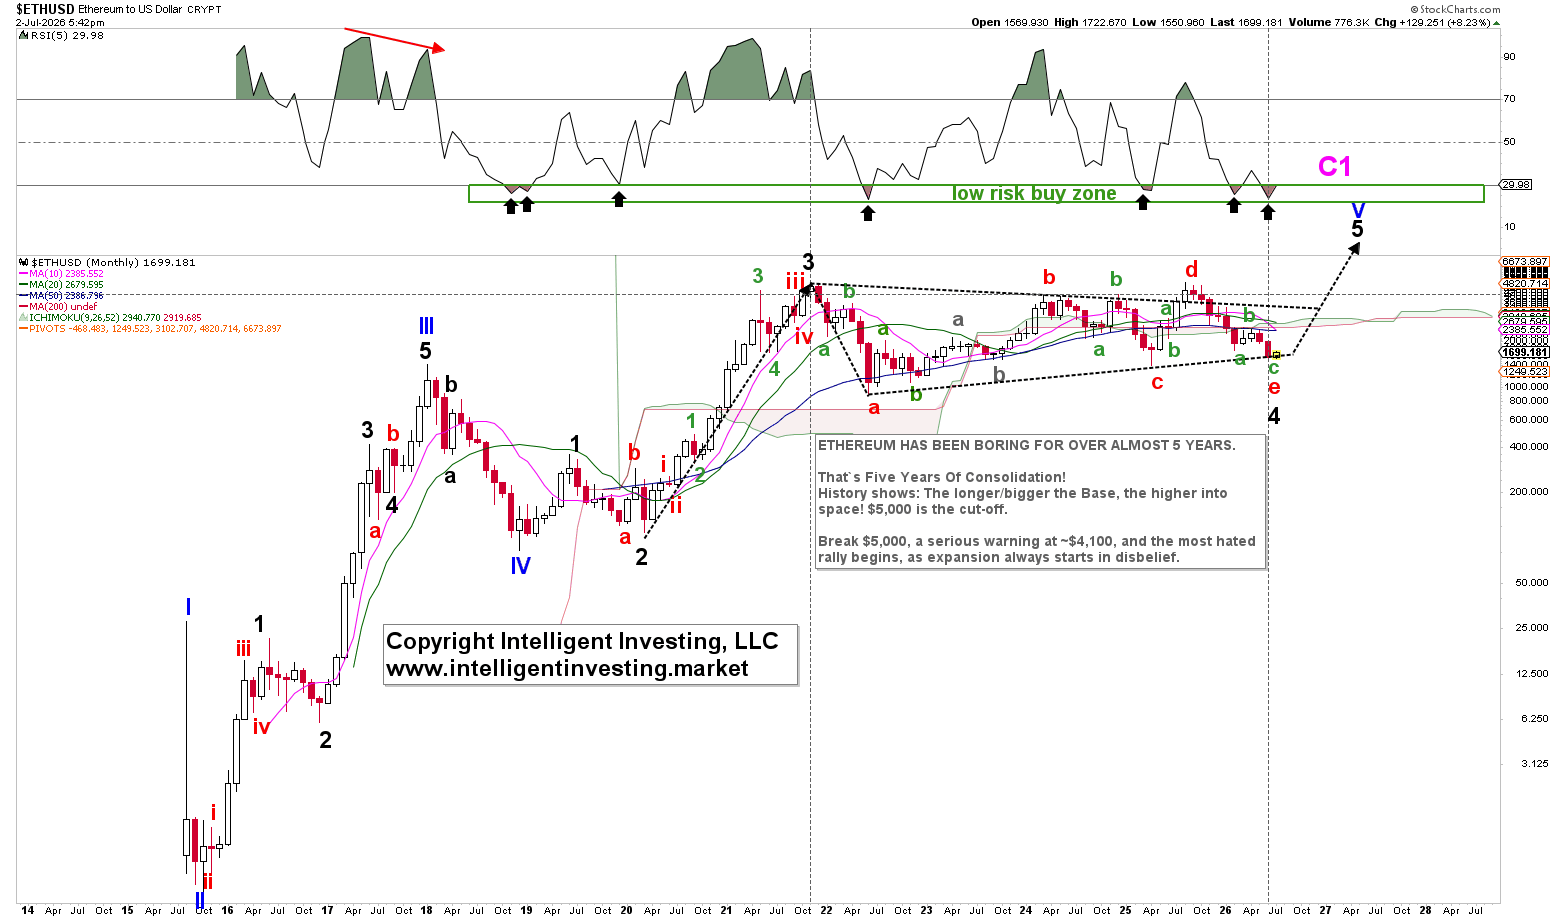
Thus, although we cannot know whether the triangle continues to play out, we should use it as one of many reference points. Triangles are not precise price structures and can vary in length and miss (i.e., overshoot) trendlines (as in 2025). But what matters is recognizing their general pattern. As such, we must incorporate additional reference points, such as the EWP and technical indicators, into our trading and investment decisions. Because it’s the weight of the evidence that provides for the most likely outcome, not the belief in one aspect over another.
Thus, in this update, we show that the weight of the evidence points toward the formation of an important low. While we don’t have confirmation yet, as ETH hasn’t even started making higher highs and higher lows, the current setups are promising.
Author

Dr. Arnout Ter Schure
Intelligent Investing, LLC
After having worked for over ten years within the field of energy and the environment, Dr.