|

Ethereum forecast: Anticipating the rally after a three-wave pullback

In this technical article we’re going to take a quick look at the Elliott Wave charts of Ethereum (ETHUSD) , published in members area of the website. As many of our members are aware, the crypto is showing impulsive bullish sequences in the cycle from the August 2024low , that are calling for a further strength.  In the further text we are going to explain the Elliott Wave Analysis.

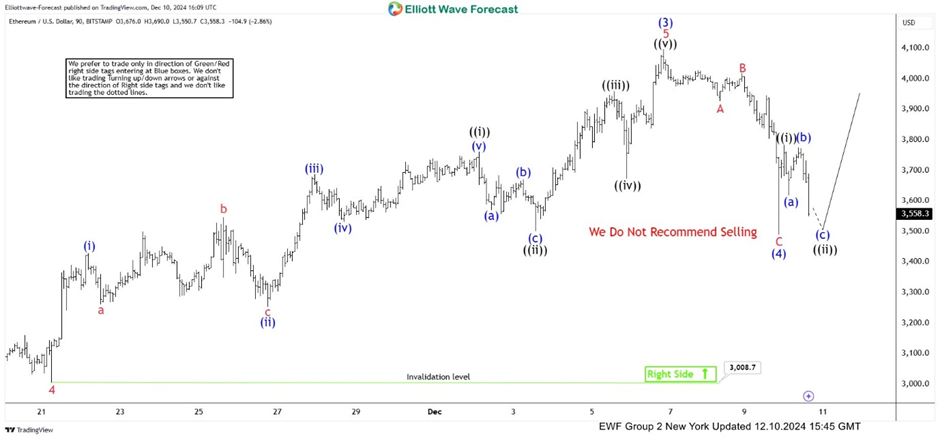
ETH/USD Elliott Wave one-hour chart 12.10.2024

ETHUSD completed wave 4 (blue) at the 3490 low, forming Elliott Wave Zig Zag pattern. Currently, we are close to completing the intraday pullback ((ii)) (black). As long as the price stays above the 3490 low, we expect further strength in the crypto. This could potentially lead to new highs. We advise against selling and prefer the long side.

Chart

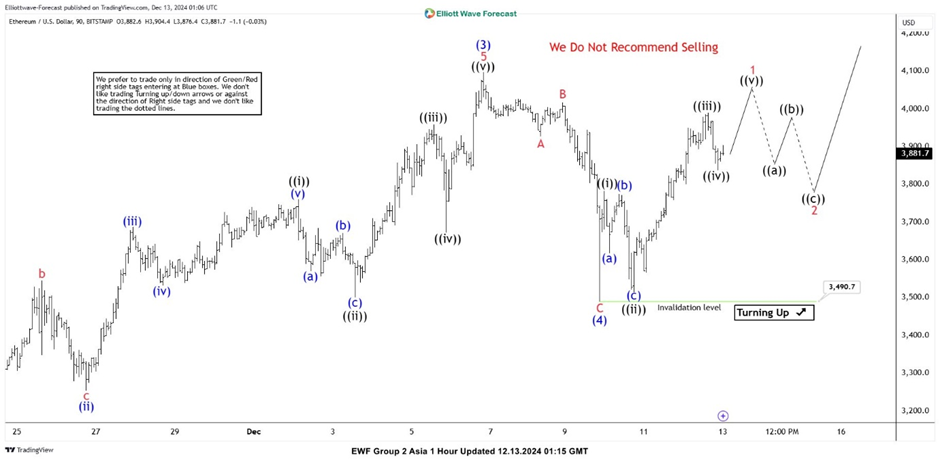
ETH/USD Elliott Wave one-hour chart 12.13.2024

Ethereum held above the 3490 low and rallied further, as expected. The current view suggests that we’ve completed 3 waves up so far. Another high would be ideal to complete the 5-wave cycle from the 3490 low. A break above the (3) blue peak (the December 6th high) would confirm that the next leg up is in progress. After this break, we can look to buy intraday dips again in the 3, 7, and 11 swings.

Chart

Author

Elliott Wave Forecast Team

Elliott Wave Forecast Team

ElliottWave-Forecast.com

More from Elliott Wave Forecast Team
Share:

Editor's Picks

Crypto Today: Bitcoin, Ethereum, XRP recovery slows amid incessant capital outflows

The cryptocurrency remains in a broader corrective bias on Friday, despite majors such as Bitcoin (BTC), Ethereum (ETH), and Ripple (XRP) holding slightly higher than early-week support levels.

Cardano: Whale selling, cautious derivatives limit ADA rebound

Cardano is trading near $0.170 at the time of writing on Friday after staging a modest rebound from last week's sharp correction. However, the recovery remains fragile as large holders have resumed reducing their positions, adding fresh selling pressure to ADA.

Experts agree: Bitcoin nears bottom, but weak demand raises doubts

Bitcoin (BTC) is trading above $63,000 at the time of writing on Friday after rebounding from the key 200-week Simple Moving Average (SMA) near $62,000, a level widely viewed as key long-term support.

Pi Network Price Forecast: Bulls attempt comeback as bearish strength fades

Pi Network is trading at around $0.120 on Friday after a modest recovery the previous day. Despite this recent rebound, traders should be cautious as a scheduled unlock of 14.8 million PI tokens on Friday could limit the token's recovery potential by increasing market supply.

Experts agree: Bitcoin nears bottom, but weak demand raises doubts
Bitcoin (BTC) is trading above $63,000 at the time of writing on Friday after rebounding from the key 200-week Simple Moving Average (SMA) near $62,000, a level widely viewed as key long-term support. The recovery may suggest that Bitcoin has found a floor after a sharp correction that spanned more than a month, but some warning signs persist.