Eli Lilly and company (LLY) forecast: Bullish Wave ((3)) targets $1571 – $1755

Eli Lilly & Company (LLY) discovers, develops & markets human pharmaceuticals worldwide. It comes under Healthcare sector & trades as “LLY” ticket at NYSE.
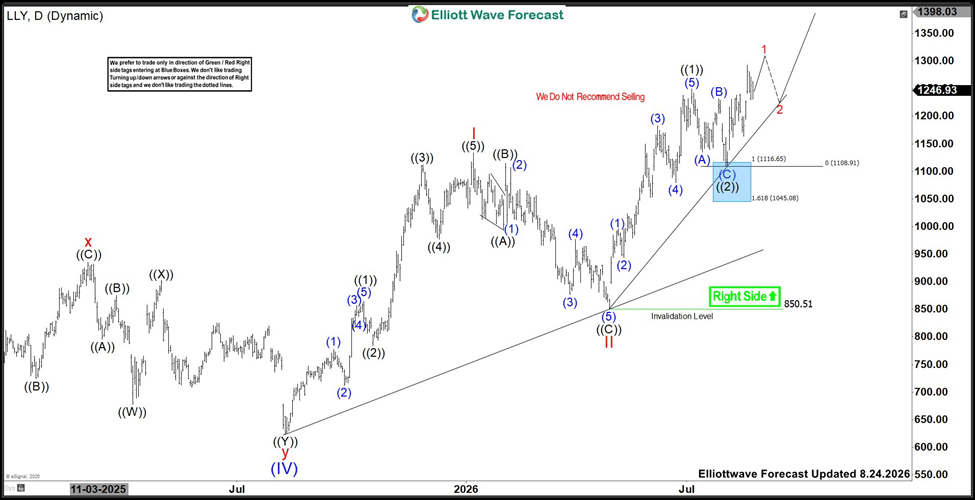
The LLY favors rally in ((3)) of III in impulse sequence against April-2026 low against 8.03.2026 low. The buyers should remain long from the daily blue box area targeting $1570.95 – $1754.56 area.
LLY – Elliott Wave latest daily view
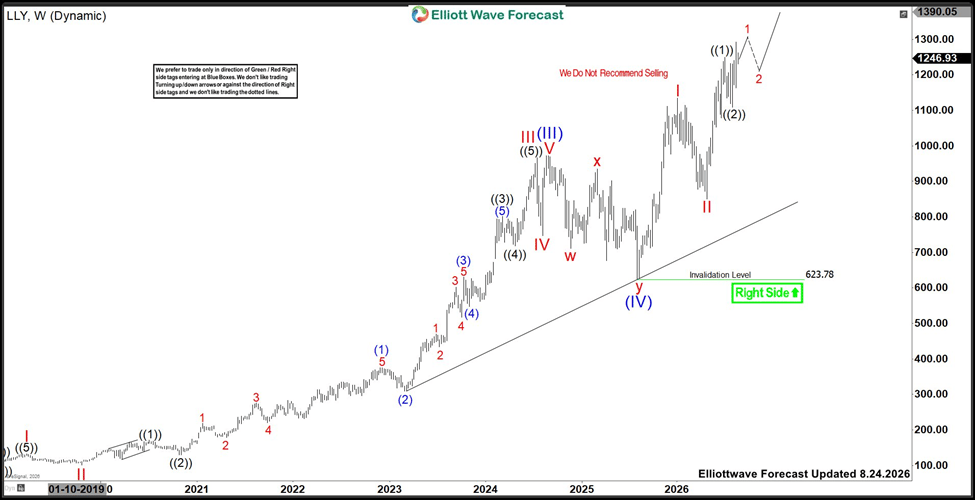
In weekly, it favors bullish impulse sequence to ATH. It placed (II) at $64.18 low in November-2016, (III) at $937.96 high in August-2024 & (IV) at $623.78 low in August-2025 low. Above (IV) low, it ended I of (V) at $1133.95 high (January-2026) & II as zigzag at $850.51 low (April-2026). Within I, it ended ((1)) at $864.35 high, ((2)) at $783.85 low, ((3)) at $1111.99 high, ((4)) at $977.12 low & ((5)) at $1133.95 high. Below I high, it ended ((A)) at $993.58 low, ((B)) at $1114 high & ((C)) as extended leg at $850.51 low.
LLY – Elliott Wave view from early August-2026
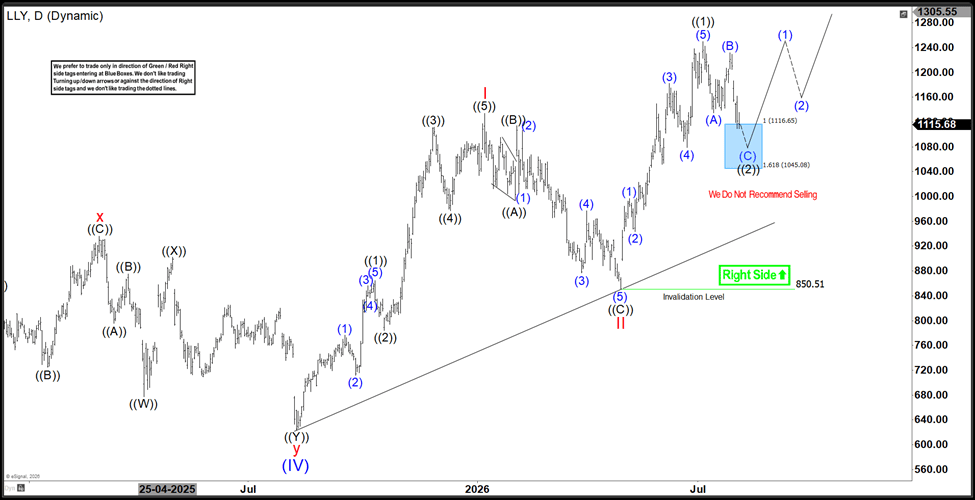
It ended ((1)) of III at $1249.45 high & ((2)) at $1109.15 low in blue box area as anticipated. Within ((1)), it ended (1) at $$99.49 high, (2) at $943.26 low, (3) at $1182.73 high, (4) at $1079.22 low & (5) at $1249.45 low. It ended (A) of ((2)) at $1134.40 low, (B) at $1232 high & ((C)) at $1109.15 low. Currently, it favors rally in 1 of (1) of ((3)). The ((3)) should extend towards $1570.95 – $1754.56 area, while dips remain above 8.03.2026 low. Alternatively, it can break below 8.03.2026 low, without extending higher to be flat in ((2)) to correct against 4.29.2026 low before resume higher in ((3)). We recommend buying extremes in 3, 7 or 11 swings against August-2026 low.
LLY – Elliott Wave latest weekly view
Author

Elliott Wave Forecast Team
ElliottWave-Forecast.com



