Dogecoin Price Prediction: DOGE on the cusp of a deeper drawdown as retail interest narrows
- Dogecoin risks extending its decline for the fourth consecutive day amid a weakening technical structure.
- DOGE’s derivatives market weakens further, with futures Open Interest falling to $1 billion.
- A sustained Dogecoin recovery appears unlikely as momentum indicators struggle to gain strength.

Dogecoin (DOGE) is paring losses around the daily open of $0.0935 on Friday, as cryptocurrencies post mild gains following a widespread pullback, driven by sentiment-related volatility stemming from the Middle East war and the hawkish stance of the Federal Reserve (Fed) on interest rate cuts in 2026.
The Fed left interest rates unchanged in the 3.50%-3.75% range on Wednesday, meeting market consensus. Fed Chair Jerome Powell further dampened sentiment, saying that there was no rush to cut rates and that the central bank continues to monitor the impact of the Iran war on the economy.
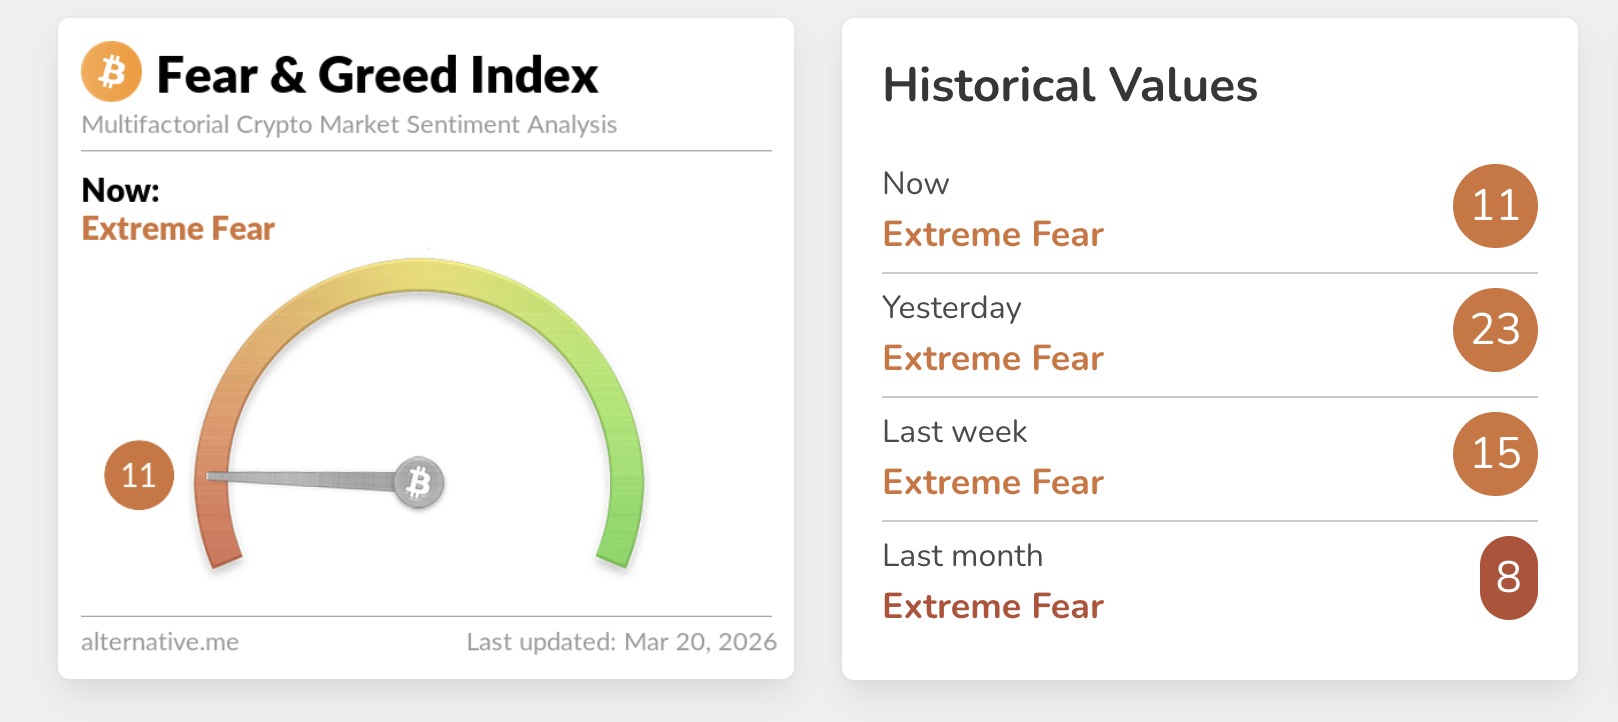
As Oil and energy prices surged, Gold, Silver and risk assets like crypto and stocks plunged, reflecting growing risk-off sentiment across global markets. The Fear & Greed index fell to 11 on Friday, in extreme fear territory, down from 23 the previous day.
Dogecoin pressured as retail interest lags
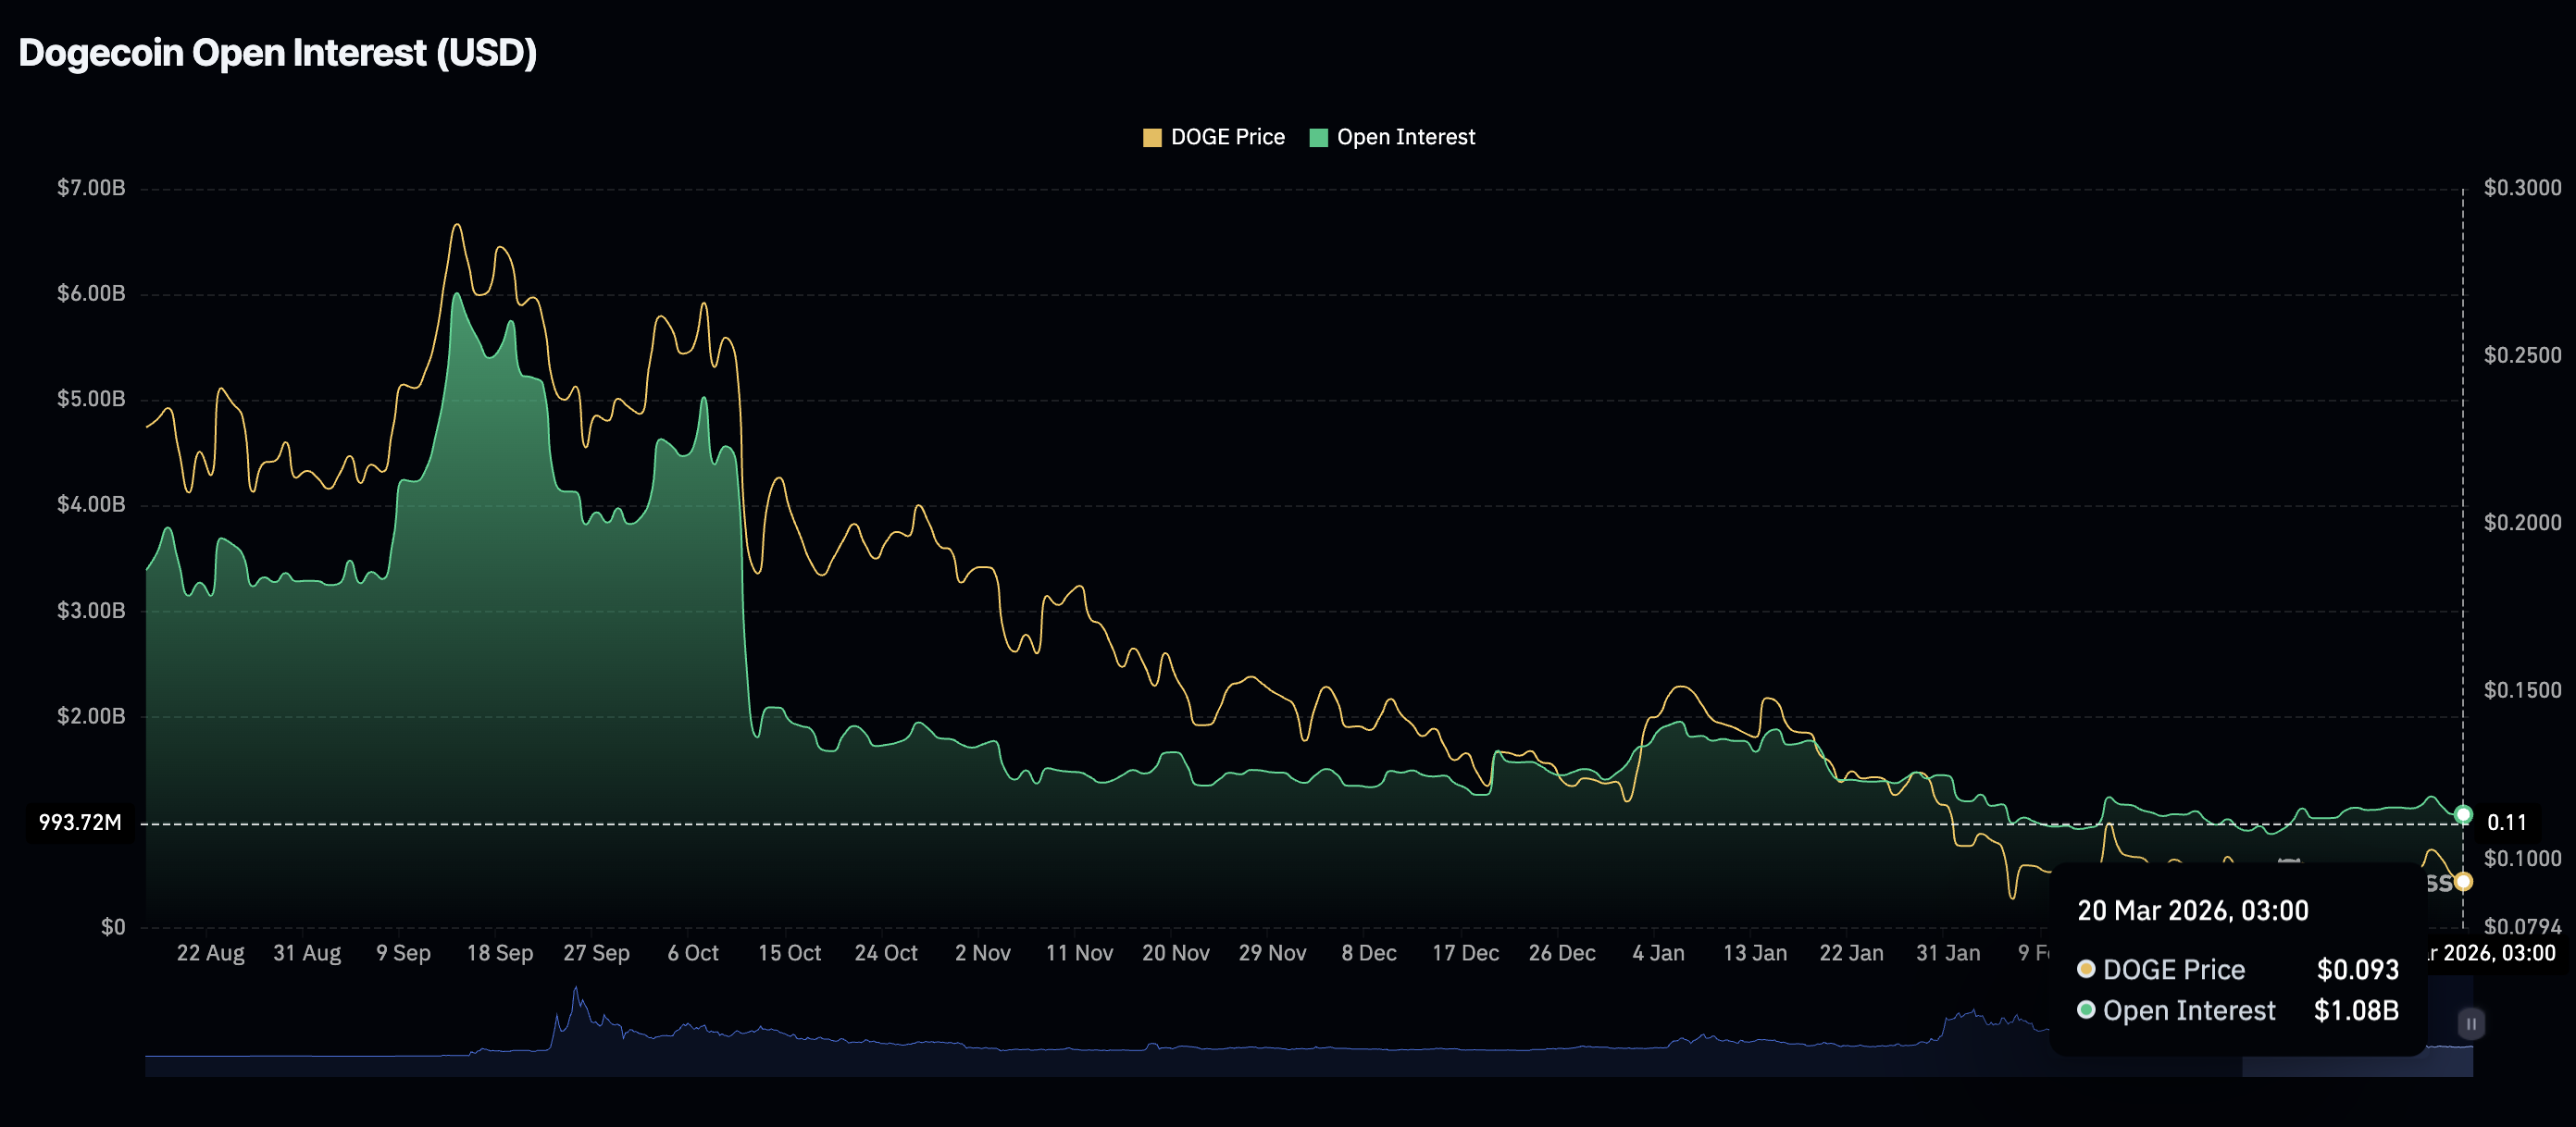
The Dogecoin derivatives market has remained on the back foot as retail traders reduce exposure amid volatility and macroeconomic uncertainty. Futures Open Interest (OI), which reflects the notional value of outstanding futures contracts, averages $1.08 billion on Friday.
An increase in OI was capped at $1.25 billion, coinciding with Dogecoin rising to $0.1045 on Tuesday. OI should steadily increase to support a steady uptrend; otherwise, headwinds will continue to weigh on the meme coin.
Technical outlook: Dogecoin holds key support amid capped upside
Dogecoin hovers around the daily open of $0.0935 after correcting from the weekly high of $0.1045. The near-term bias stays mildly bearish as price holds well below the 50-day, 100-day and 200-day Exponential Moving Averages (EMAs), which all slope downward and signal a dominant broader downtrend.
Moreover, DOGE continues to oscillate beneath a descending resistance trendline, suggesting that rallies remain capped within a longer-term bearish structure. The Moving Average Convergence Divergence (MACD) indicator eases back toward the signal line with both lines near the zero mark on the daily chart. Contracting green histogram bars indicate upside momentum is fading after the recent rebound. At the same time, the Relative Strength Index (RSI) hovers in the mid-40s on the same chart, reinforcing a lack of strong buying pressure and aligning with a corrective-to-sideways tone within the broader decline.
-1774019619593-1774019619598.png)
Immediate resistance lies near $0.0970, where recent highs cluster just below the descending trend line, followed by $0.1010, which coincides with the trend-line break area and marks a more significant barrier for bulls. A daily close above $0.1010 would open the way toward the weekly high area at $0.1030.
On the downside, initial support emerges at $0.09177, guarding Thursday's lows, then at $0.0900, the March floor that has repeatedly attracted demand. A clear break beneath $0.0900 would expose $0.0870, where sellers could extend control and resume the dominant bearish leg.
Open Interest, funding rate FAQs
Higher Open Interest is associated with higher liquidity and new capital inflow to the market. This is considered the equivalent of increase in efficiency and the ongoing trend continues. When Open Interest decreases, it is considered a sign of liquidation in the market, investors are leaving and the overall demand for an asset is on a decline, fueling a bearish sentiment among investors.
Funding fees bridge the difference between spot prices and prices of futures contracts of an asset by increasing liquidation risks faced by traders. A consistently high and positive funding rate implies there is a bullish sentiment among market participants and there is an expectation of a price hike. A consistently negative funding rate for an asset implies a bearish sentiment, indicating that traders expect the cryptocurrency’s price to fall and a bearish trend reversal is likely to occur.
(The technical analysis of this story was written with the help of an AI tool.)
Author

John Isige
FXStreet
John Isige is a seasoned cryptocurrency journalist and markets analyst committed to delivering high-quality, actionable insights tailored to traders, investors, and crypto enthusiasts. He enjoys deep dives into emerging Web3 tren




