Dogecoin Price Forecast: DOGE slumps below $0.1000 despite steady retail demand
- Dogecoin edges lower, trading around $0.0975 on Tuesday amid intensifying selling in the broader crypto market.
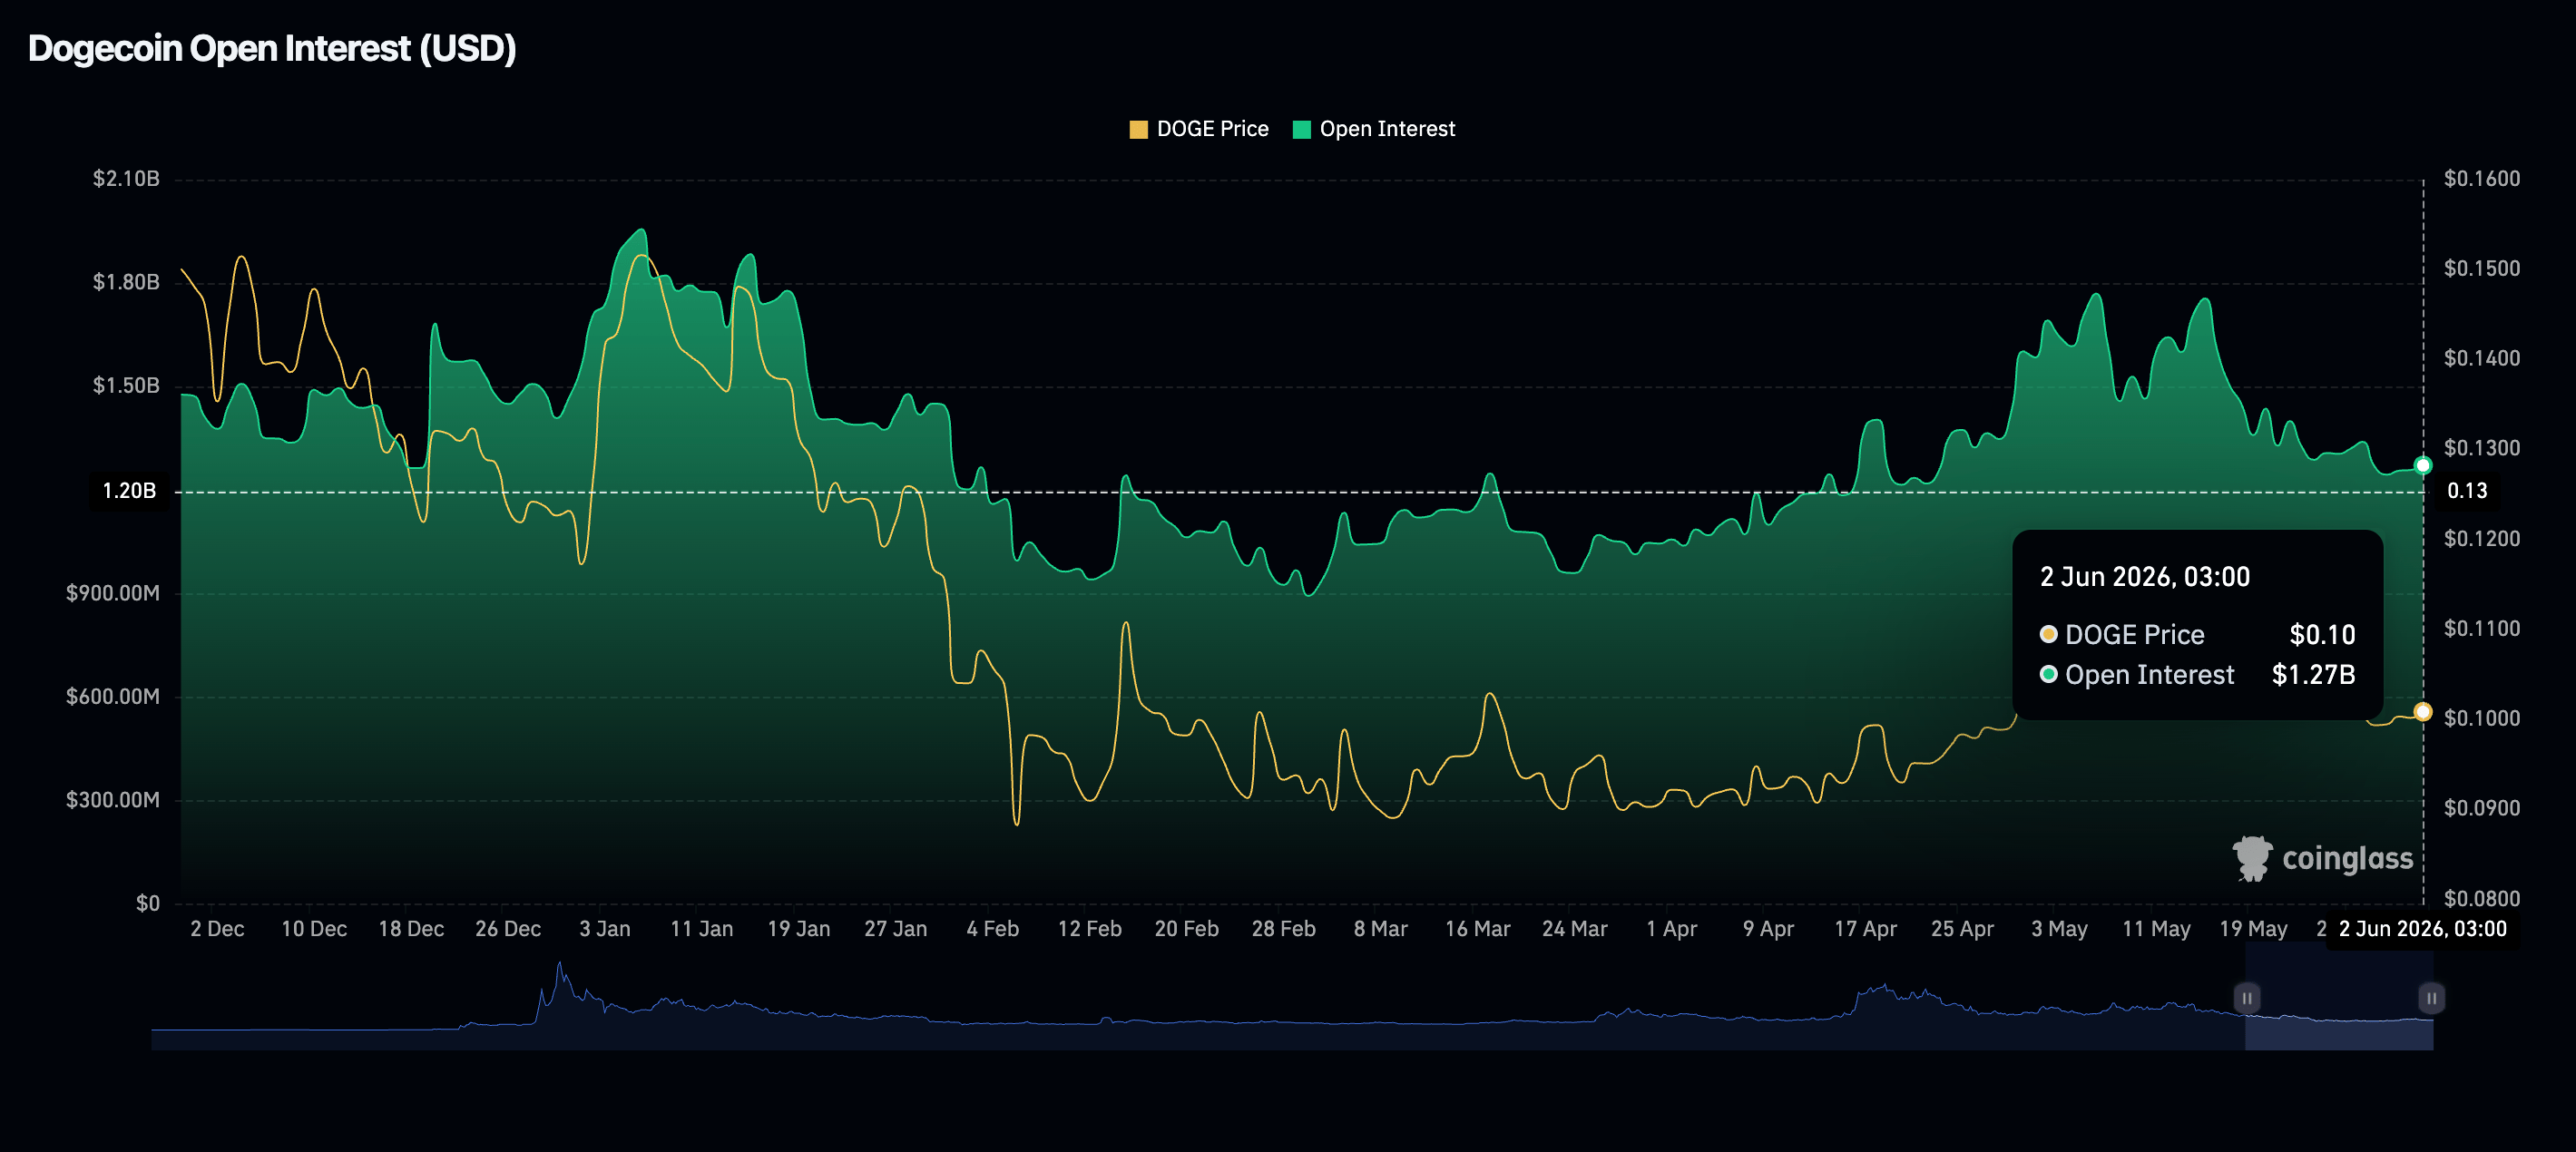
- Dogecoin retail demand holds steady around $1.27 billion, but market sentiment remains subdued amid ongoing selling pressure.
- DOGE trades below major downtrending moving averages, while momentum indicators signal a persistent decline.

Dogecoin (DOGE) remains heavily pressured on Tuesday as the leading meme coin extends its correction below the pivotal $1.0000 level. The ongoing sell-off can be attributed, among other factors, to tensions in the Middle East, which continue to undermine the appeal of risk assets, and to the lack of catalysts to sustain a broader bullish outlook.
DOGE sees mild retail participation
Retail interest in Dogecoin derivatives remains relatively steady, with futures Open Interest (OI) averaging $1.27 billion on Tuesday, up from the $1.26 billion recorded the day before. Although mild, demand via derivatives suggests that investors are cautiously opening new positions. If demand remains steady or increases, it could signal Dogecoin has the potential to regain momentum above the $1.0000 level.
Price analysis: Dogecoin accelerates pullback
Dogecoin trades at $0.0976, extending its pullback below all short and medium-term Exponential Moving Averages (EMAs) and keeping the near-term bias bearish. The 50-day EMA at $0.1027 and the 100-day EMA at $0.1050 now sit overhead as dynamic resistance, reinforcing the weight of the broader downtrend resistance line that was last broken near $0.1170.
The SuperTrend indicator, tracking at $0.1112, also runs above spot, hinting that rallies are likely to be sold while price remains capped beneath this confluence. Meanwhile, the Relative Strength Index (RSI) has slipped toward 36 on the daily, with the Moving Average Convergence Divergence (MACD) histogram in negative territory, suggesting persistent but not yet extreme downside momentum.
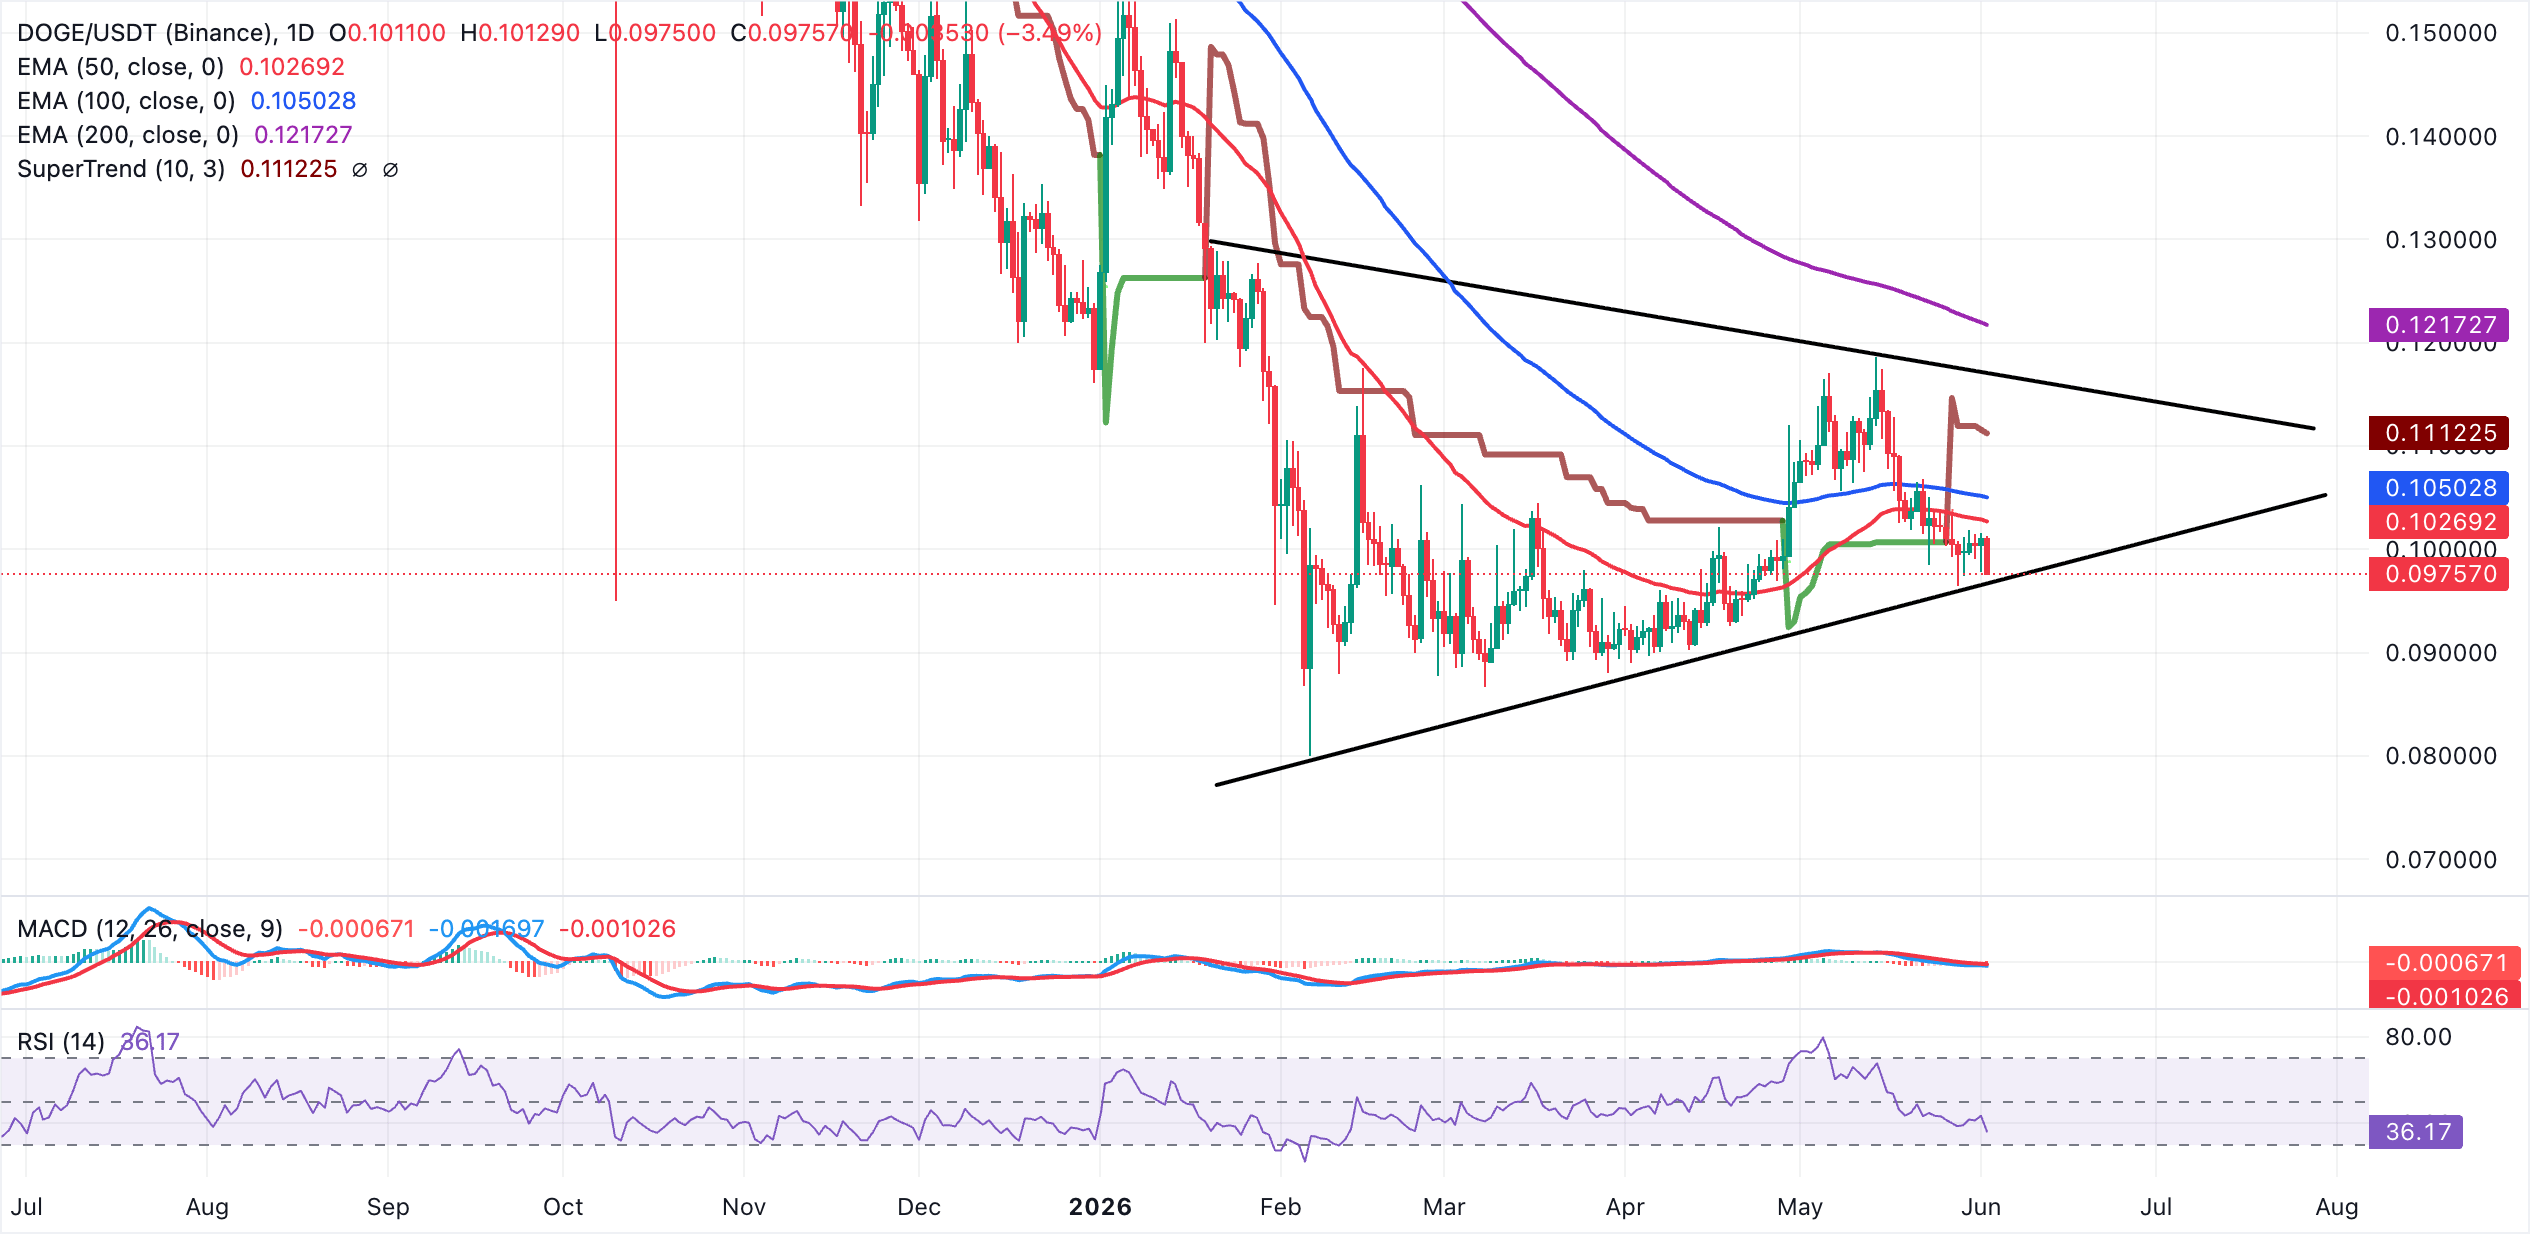
On the downside, initial support lies at the prior ascending trendline break area around $0.0968. A sustained close below this shelf would expose deeper weakness toward the $0.0900 region, though that level is not explicitly defined by current indicators. On the topside, bulls would first need to reclaim the 50-day EMA at $0.1027, with further recovery attempts likely to face resistance at the 100-day EMA at $0.1050 and the SuperTrend line at $0.1112. Beyond that supply range, the descending resistance trendline near $0.1170 and the 200-day EMA at $0.1217 define a broader supply zone that is likely to cap any stronger bounce while the daily structure remains under these levels.
(The technical analysis of this story was written with the help of an AI tool.)
Open Interest, funding rate FAQs
Higher Open Interest is associated with higher liquidity and new capital inflow to the market. This is considered the equivalent of increase in efficiency and the ongoing trend continues. When Open Interest decreases, it is considered a sign of liquidation in the market, investors are leaving and the overall demand for an asset is on a decline, fueling a bearish sentiment among investors.
Funding fees bridge the difference between spot prices and prices of futures contracts of an asset by increasing liquidation risks faced by traders. A consistently high and positive funding rate implies there is a bullish sentiment among market participants and there is an expectation of a price hike. A consistently negative funding rate for an asset implies a bearish sentiment, indicating that traders expect the cryptocurrency’s price to fall and a bearish trend reversal is likely to occur.
Author

John Isige
FXStreet
John Isige is a seasoned cryptocurrency journalist and markets analyst committed to delivering high-quality, actionable insights tailored to traders, investors, and crypto enthusiasts. He enjoys deep dives into emerging Web3 tren



