Dogecoin Elliott Wave technical analysis [Video]
![Dogecoin Elliott Wave technical analysis [Video]](https://editorial.fxstreet.com/images/Markets/Currencies/Cryptocurrencies/Dogecoin/dogecoin-200x200-637483778649728159.jpg)
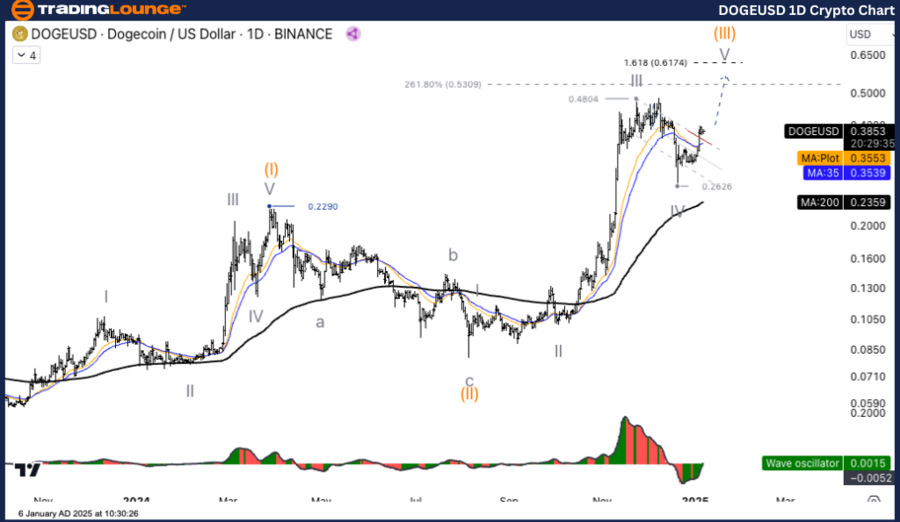
DOGE/USD Elliott Wave technical analysis
Function: Counter trend.
Mode: Corrective.
Structure: Double Corrective.
Position: Wave ((Y)).
Direction Next higher Degrees: wave ((Y)) of IV.
Details: The corrective of Wave IV Maybe complete and the price Increase again in Wave V.
Dogecoin/ US Dollar (DOGEUSD) Trading Strategy: Wave IV appears to have ended at 0.2626, so the overall picture is a rally above 0.4804 of wave V, with a chance of testing 0.6174.
Dogecoin/ US Dollar (DOGEUSD) Technical Indicators: The price is above the MA200 indicating an uptrend, The Wave Oscillator is a Bullish Momentum.
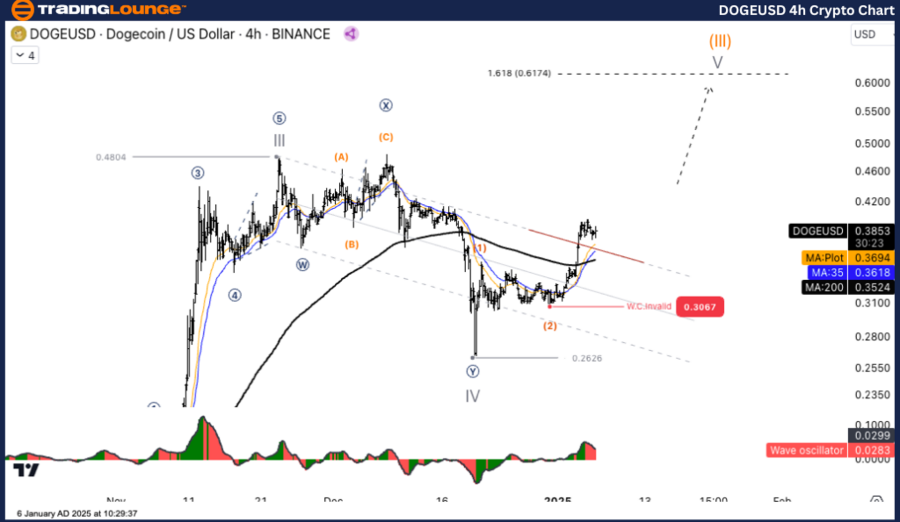
DOGE/USD Elliott Wave technical analysis
Function: Counter trend.
Mode: Corrective.
Structure: Double Corrective.
Position: Wave ((Y)).
Direction Next higher Degrees: Wave ((Y)) of IV.
Details: The corrective of Wave IV Maybe complete and the price Increase again in Wave V.
Dogecoin/ US Dollar (DOGE/USD) Trading Strategy: Wave IV appears to have ended at 0.2626, so the overall picture is a rally above 0.4804 of wave V, with a chance of testing 0.6174.
Dogecoin/ US Dollar (DOGE/USD) Technical Indicators: The price is above the MA200 indicating an uptrend, The Wave Oscillator is a Bullish Momentum.
Dogecoin Elliott Wave technical analysis [Video]
Author

Peter Mathers
TradingLounge
Peter Mathers started actively trading in 1982. He began his career at Hoei and Shoin, a Japanese futures trading company.


