Dogecoin Elliott Wave technical analysis [Video]
![Dogecoin Elliott Wave technical analysis [Video]](https://editorial.fxstreet.com/images/Markets/Currencies/Cryptocurrencies/Dogecoin/Doge_Coin_31_02.jpg)
DOGE/USD Elliott Wave technical analysis
Function: Counter trend.
Mode: Corrective.
Structure: Zigzag.
Position: Wave ((C)).
Direction next higher degrees: Wave IV of impulse.
Details: Wave IV May is complete and the price increase again in wave V.
DOGE/USD trading strategy
Overall, Dogecoin remains in an uptrend. Moreover, it looks like the correction is over. And prices are rising again in the fifth wave. But there may be a slight pullback before increasing. So look for opportunities to join the uptrend.
DOGE/USD technical indicators
The price is above the MA200 indicating an uptrend, the wave oscillator is a bullish momentum.
.thumb-638524604307579401.png.37689f22ac459ef2975cc54b59c6d3e0-638524604307579401.png)
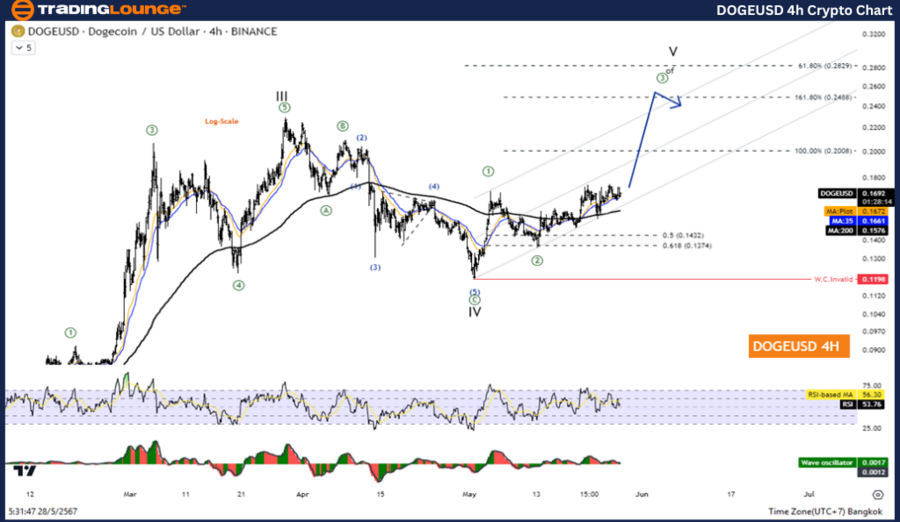
DOGE/USD Elliott Wave technical analysis
Function: Follow trend.
Mode: Motive.
Structure: Impulse.
Position: Wave ((3)).
Direction next higher degrees: Wave V of impulse.
Details: Wave ((3)) is equal to 161.8% of wave ((1)) at 0.2488.
DOGE/USD trading strategy
Overall, Dogecoin remains in an uptrend. Moreover, it looks like the correction is over. And prices are rising again in the fifth wave. But there may be a slight pullback before increasing. So look for opportunities to join the uptrend.
DOGE/USD technical indicators
The price is above the MA200 indicating an uptrend, the wave oscillator is a bullish momentum.
DOGE/USD Elliott Wave technical analysis [Video]
Author

Peter Mathers
TradingLounge
Peter Mathers started actively trading in 1982. He began his career at Hoei and Shoin, a Japanese futures trading company.


