Cryptocurrencies Price Prediction: Bitcoin, Ethereum & Shiba Inu – European Wrap 19 June

Recent Bitcoin price crash triggers whales to scoop BTC at discount
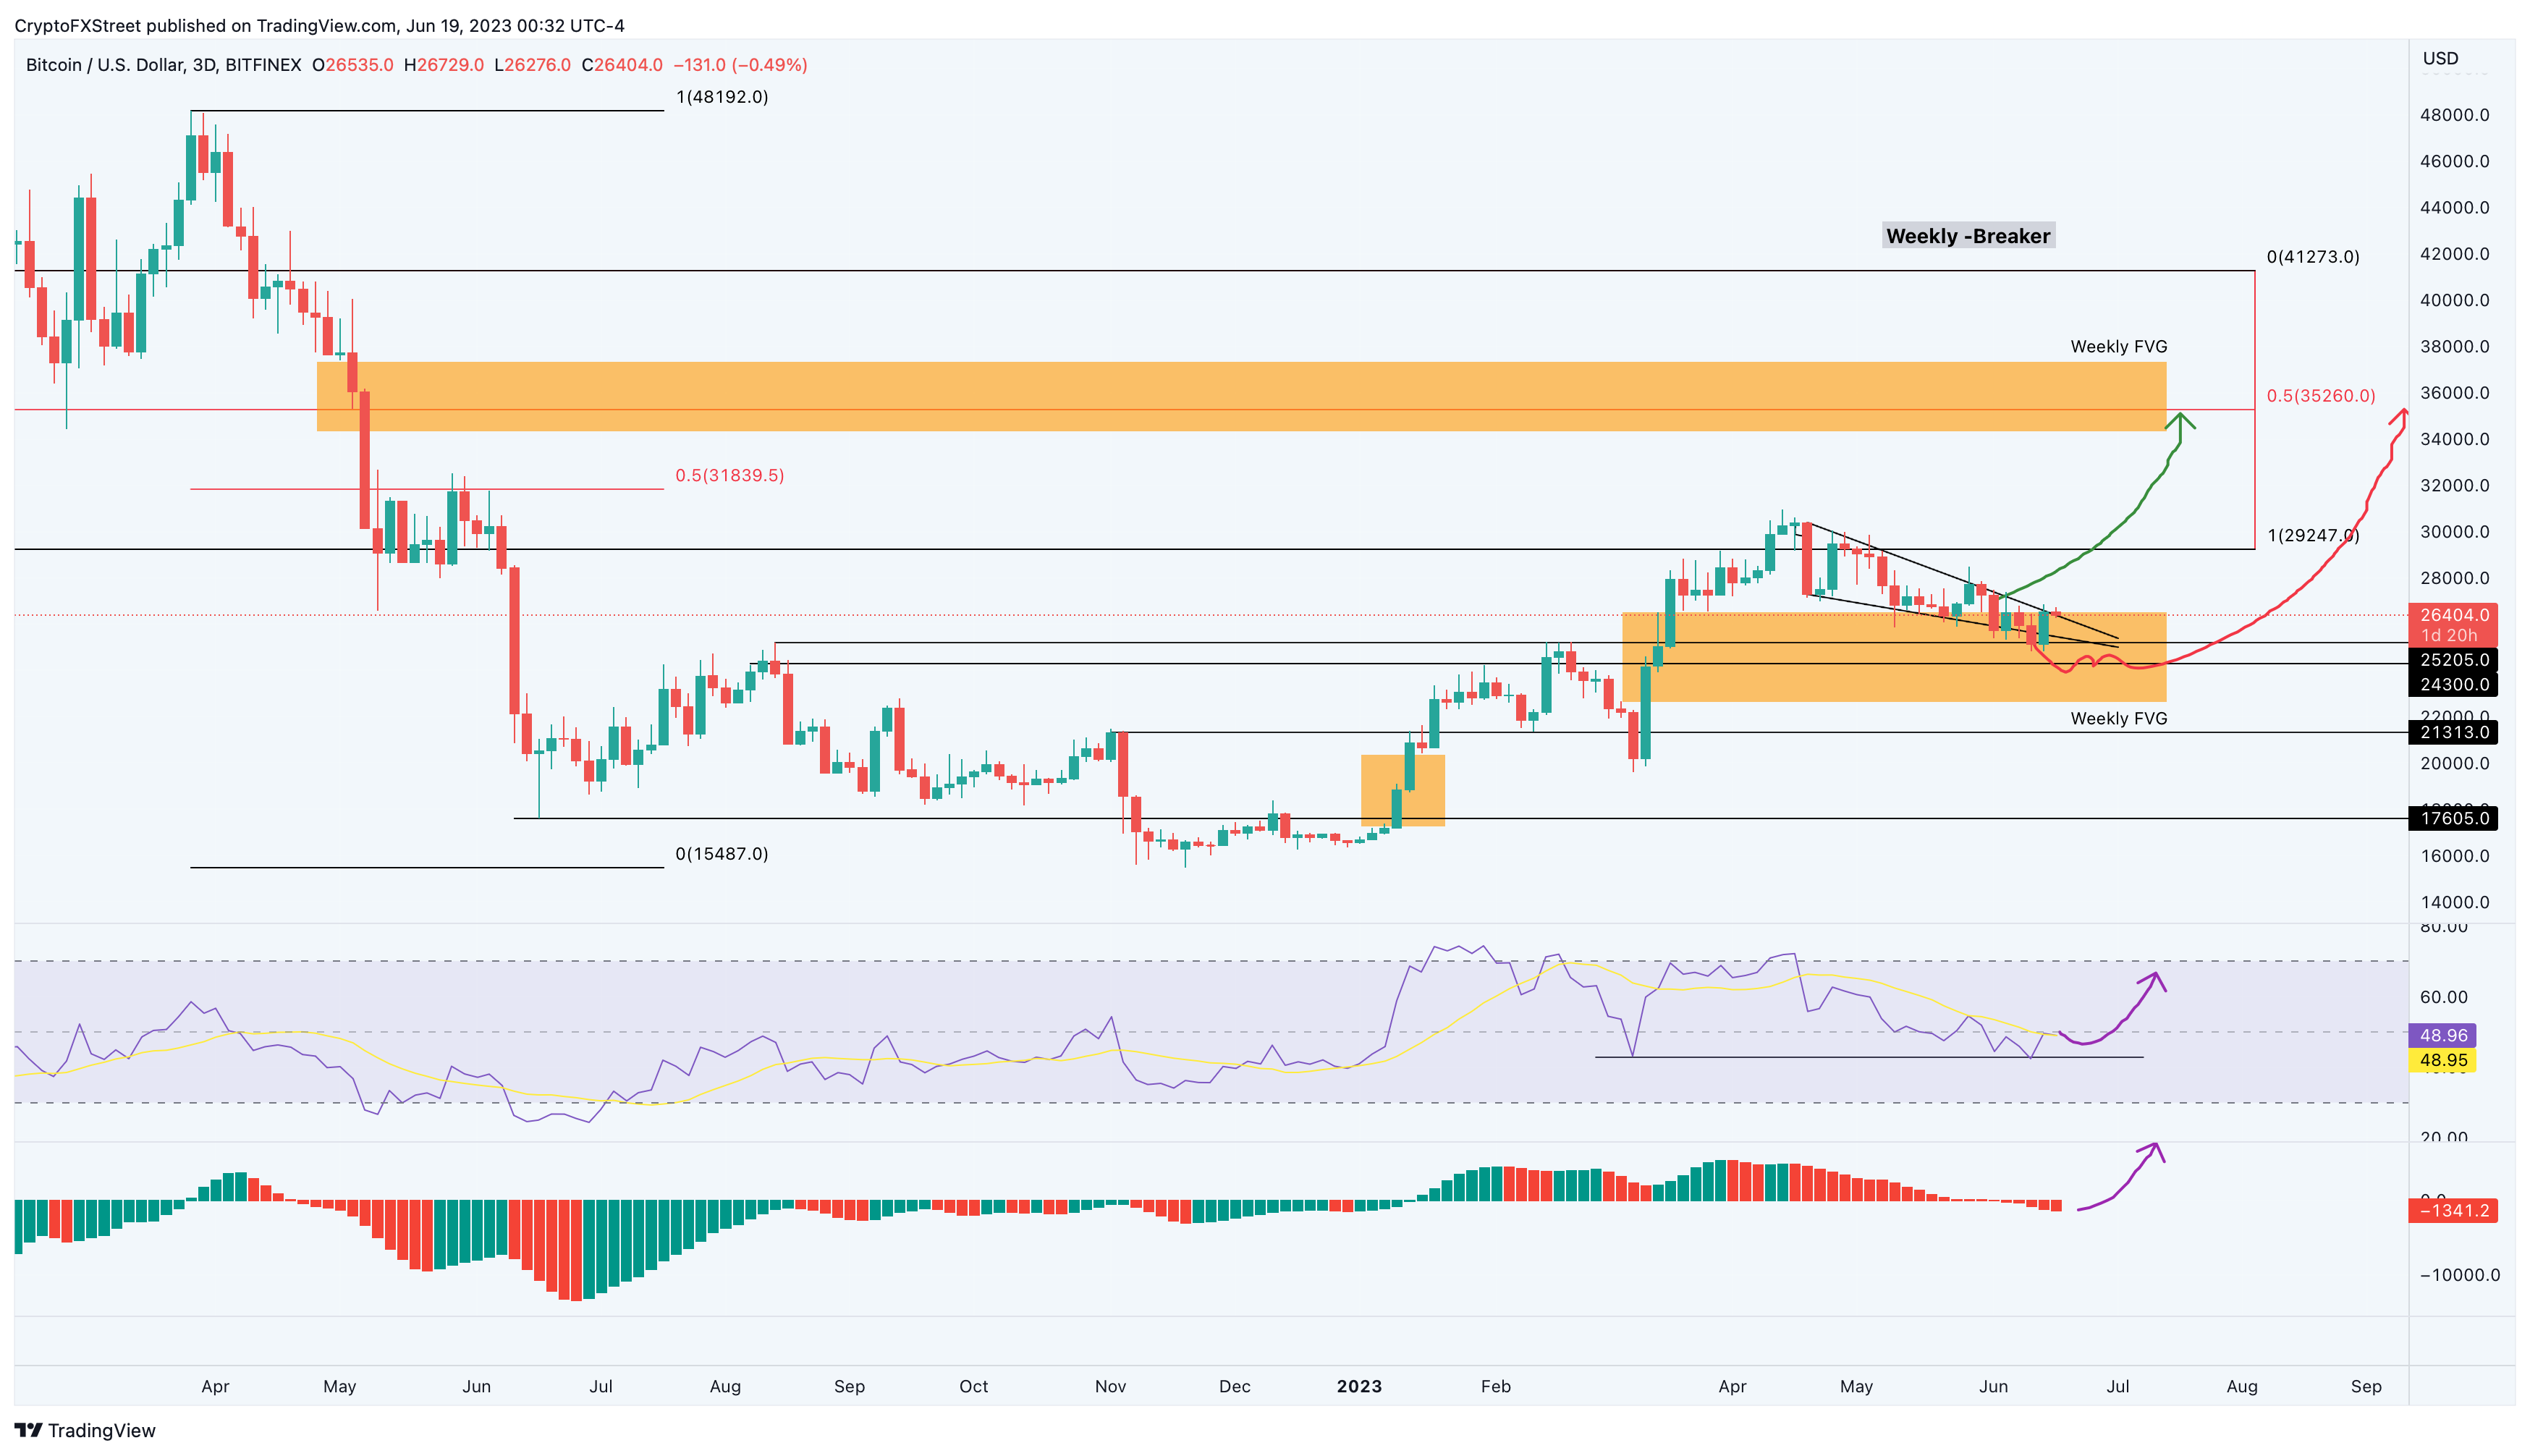
Bitcoin price saw a sudden sell-off on April 19 and has been crashing since. The recent spike in bearish momentum pushed BTC down to $24,825, but an uptick in the presence of buyers has simultaneously triggered a recovery rally.
Bitcoin price has dropped from a local top of $30,968 and reached a potential local bottom at $24,825 on June 15. Since then, BTC has shot up 8% and currently trades at $26,452. The chart below shows that the Relative Strength Index (RSI) has produced equal lows while BTC has set up higher lows.
Ethereum (ETH/USD) Elliott Wave: Forecasting the path
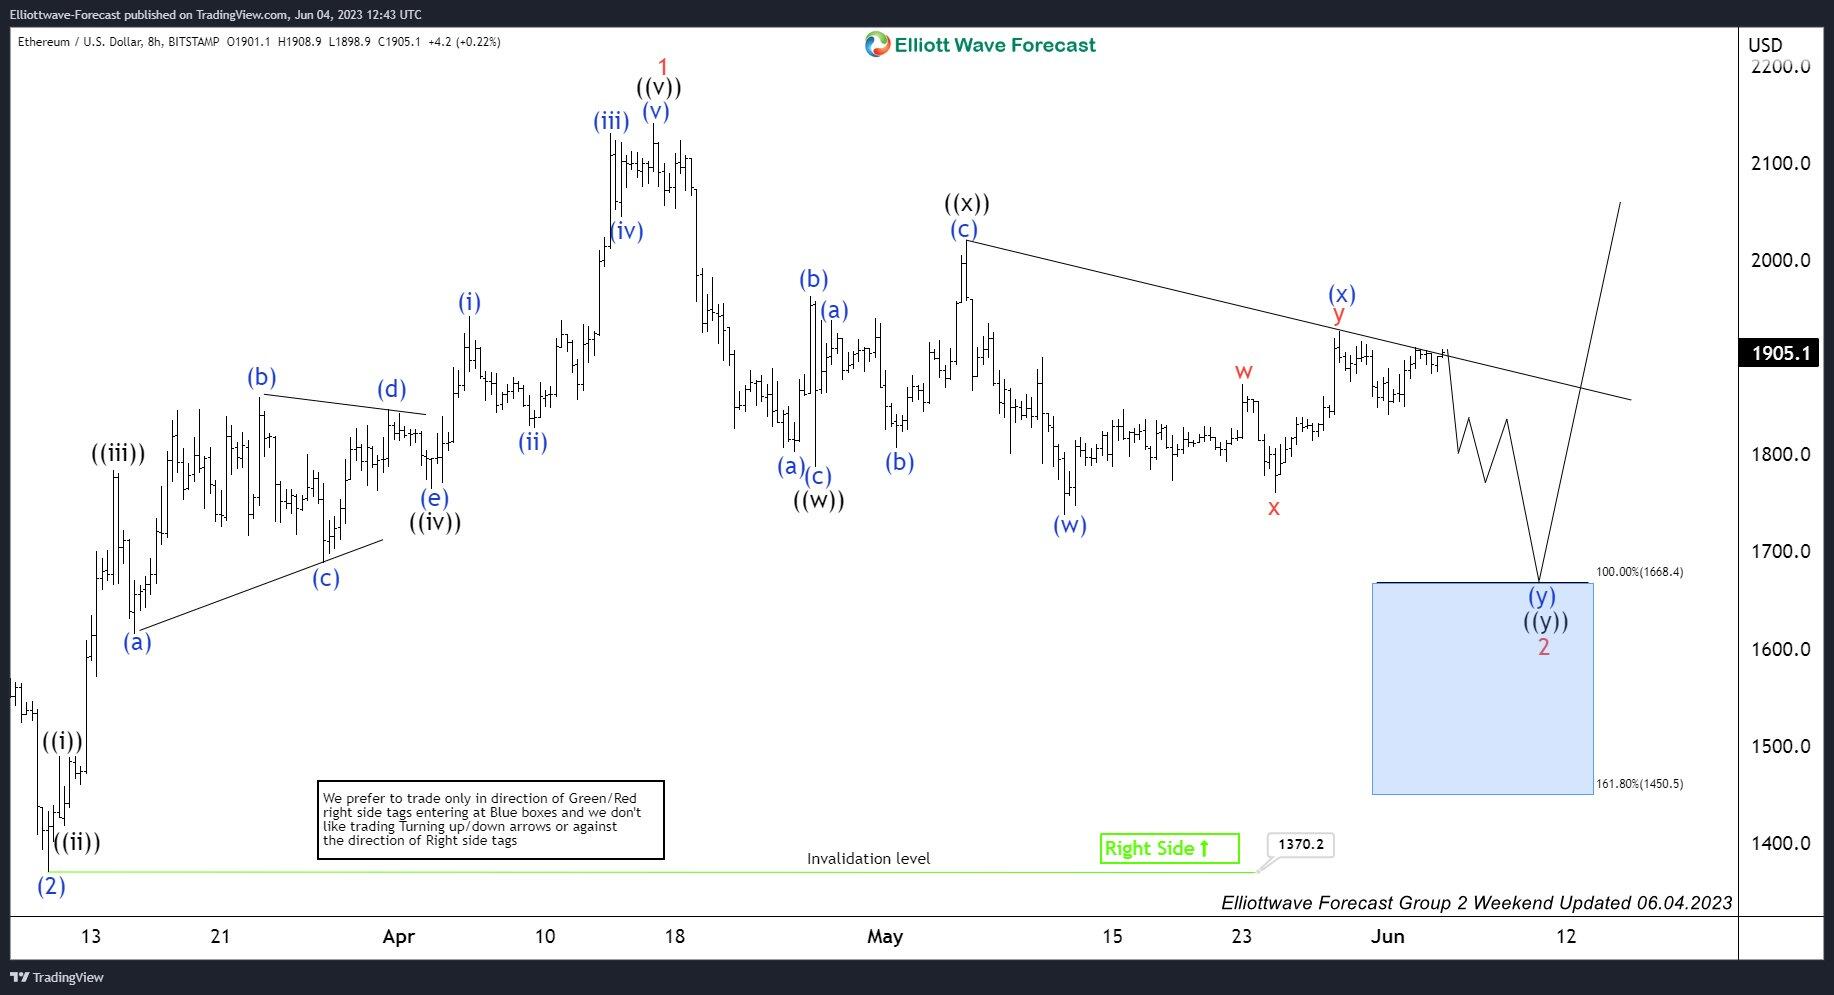
In this technical article we’re going to take a look at the Elliott Wave charts of Ethereum ( ETHUSD ) published in members area of the website. As our members know ETHUSD reached extreme zone ( buying zone) in the cycle from the April 16th peak. In further text we’re going to explain the Elliott Wave structure and the forecast.
ETH/USD is showing incomplete bearish sequences in the cycle from the April 16th peak. At this stage we believe correction is unfolding as Elliott Wave Double Three Pattern. We call (x) blue connector completed at 1927 high. As far as the price stays below that high, Ethereum should ideally make another leg down toward 1668.4-1450.5 area. At the marked blue box zone buyers should ideally appear again.
Shiba Inu, Maker, XRP begin recovery as crypto buying power returns
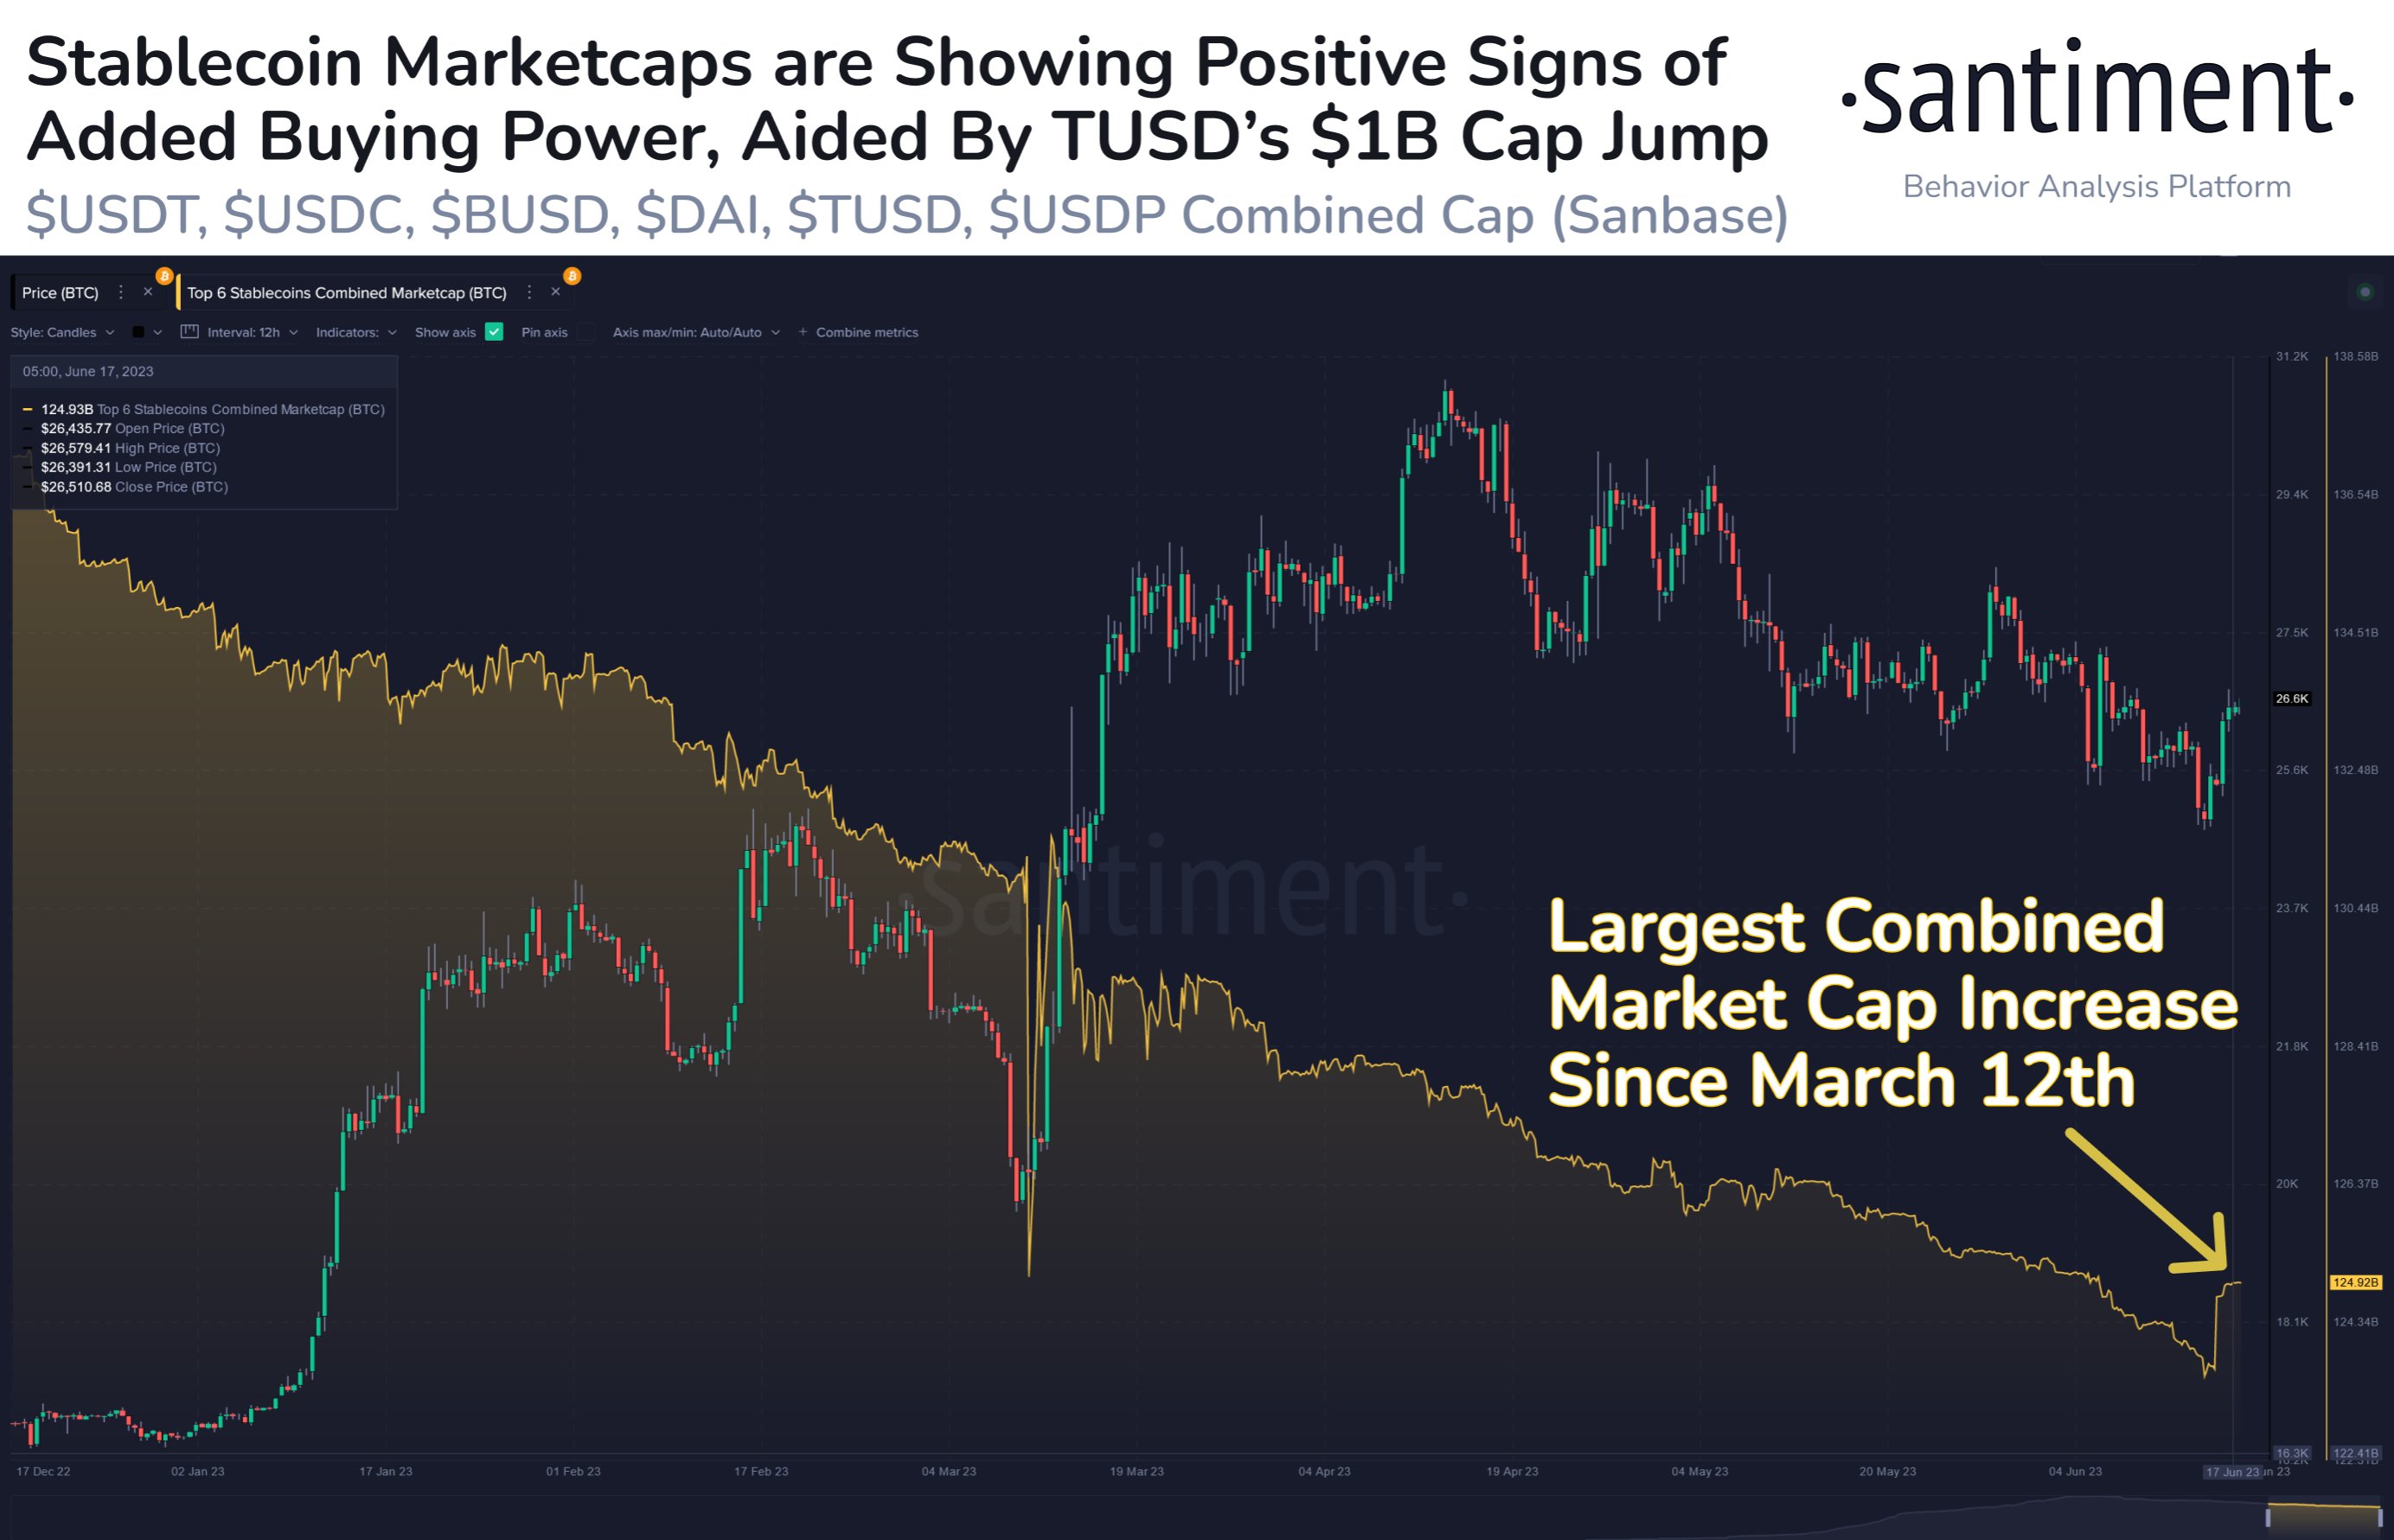
The Securities & Exchange Commission’s (SEC) crackdown on cryptocurrencies triggered a marketwide crypto bloodbath between June 5 and the weekend. The recent jump in the combined market capitalization of leading stablecoins points to a likely increase in buying power in crypto. Rising purchasing power is conducive to recovery in altcoins.
True USD (TUSD) market capitalisation climbed by $1 billion over the weekend. This is a key milestone in the stablecoin ecosystem. After a gradual decline over the last 15 months, the market capitalisation of the top six stablecoins - USD Tether (USDT), USD Coin (USDC), Binance USD (BUSD), DAI, True USD (TUSD),and USDP Stablecoin (USDP) - jumped up alongside TUSD’s rise.
Author

FXStreet Team
FXStreet
Composed of a group of economic journalists and FX experts, the FXStreet content team produces and oversees all content published on FXStreet. It provides a purely journalistic approach to the Forex market.



