Crypto Today: Bitcoin, Ethereum, XRP technicals deteriorate amid war-driven risk-off sentiment
- Bitcoin slips below $67,000 as war-driven risk aversion weighs on the broader crypto market.
- Ethereum continues its downward trajectory but remains supported above the $2,000 level as ETF outflows return.
- XRP pares back recent gains as prices retest the $1.30 support level, with technical momentum indicators signaling further downside risk.

Bitcoin (BTC) edges lower below $67,000 at the time of writing on Thursday, reflecting the risk-off sentiment in the broader cryptocurrency market driven by the Iran war.
Ethereum (ETH) follows suit, with the price slipping toward the pivotal $2,000 level, while XRP declines, nearing support at $1.30. The risk-off sentiment gripping the market has spread, as evidenced by capital exiting digital investment products.
Bitcoin, Ethereum, XRP face capital exit amid ETF outflows
Interest in crypto investment products has remained shaky amid the United States (US) and Israel’s war with Iran, which is now in its second month. US President Donald Trump claimed military success on Wednesday, even as the war rages on.
Meanwhile, Iran is widening its attacks, with Gulf nations reporting fresh missile and drone attacks on Thursday. Risk assets, including crypto and stocks, are slipping lower, amid pressured conditions as risk-off sentiment persists, while Oil prices surge.
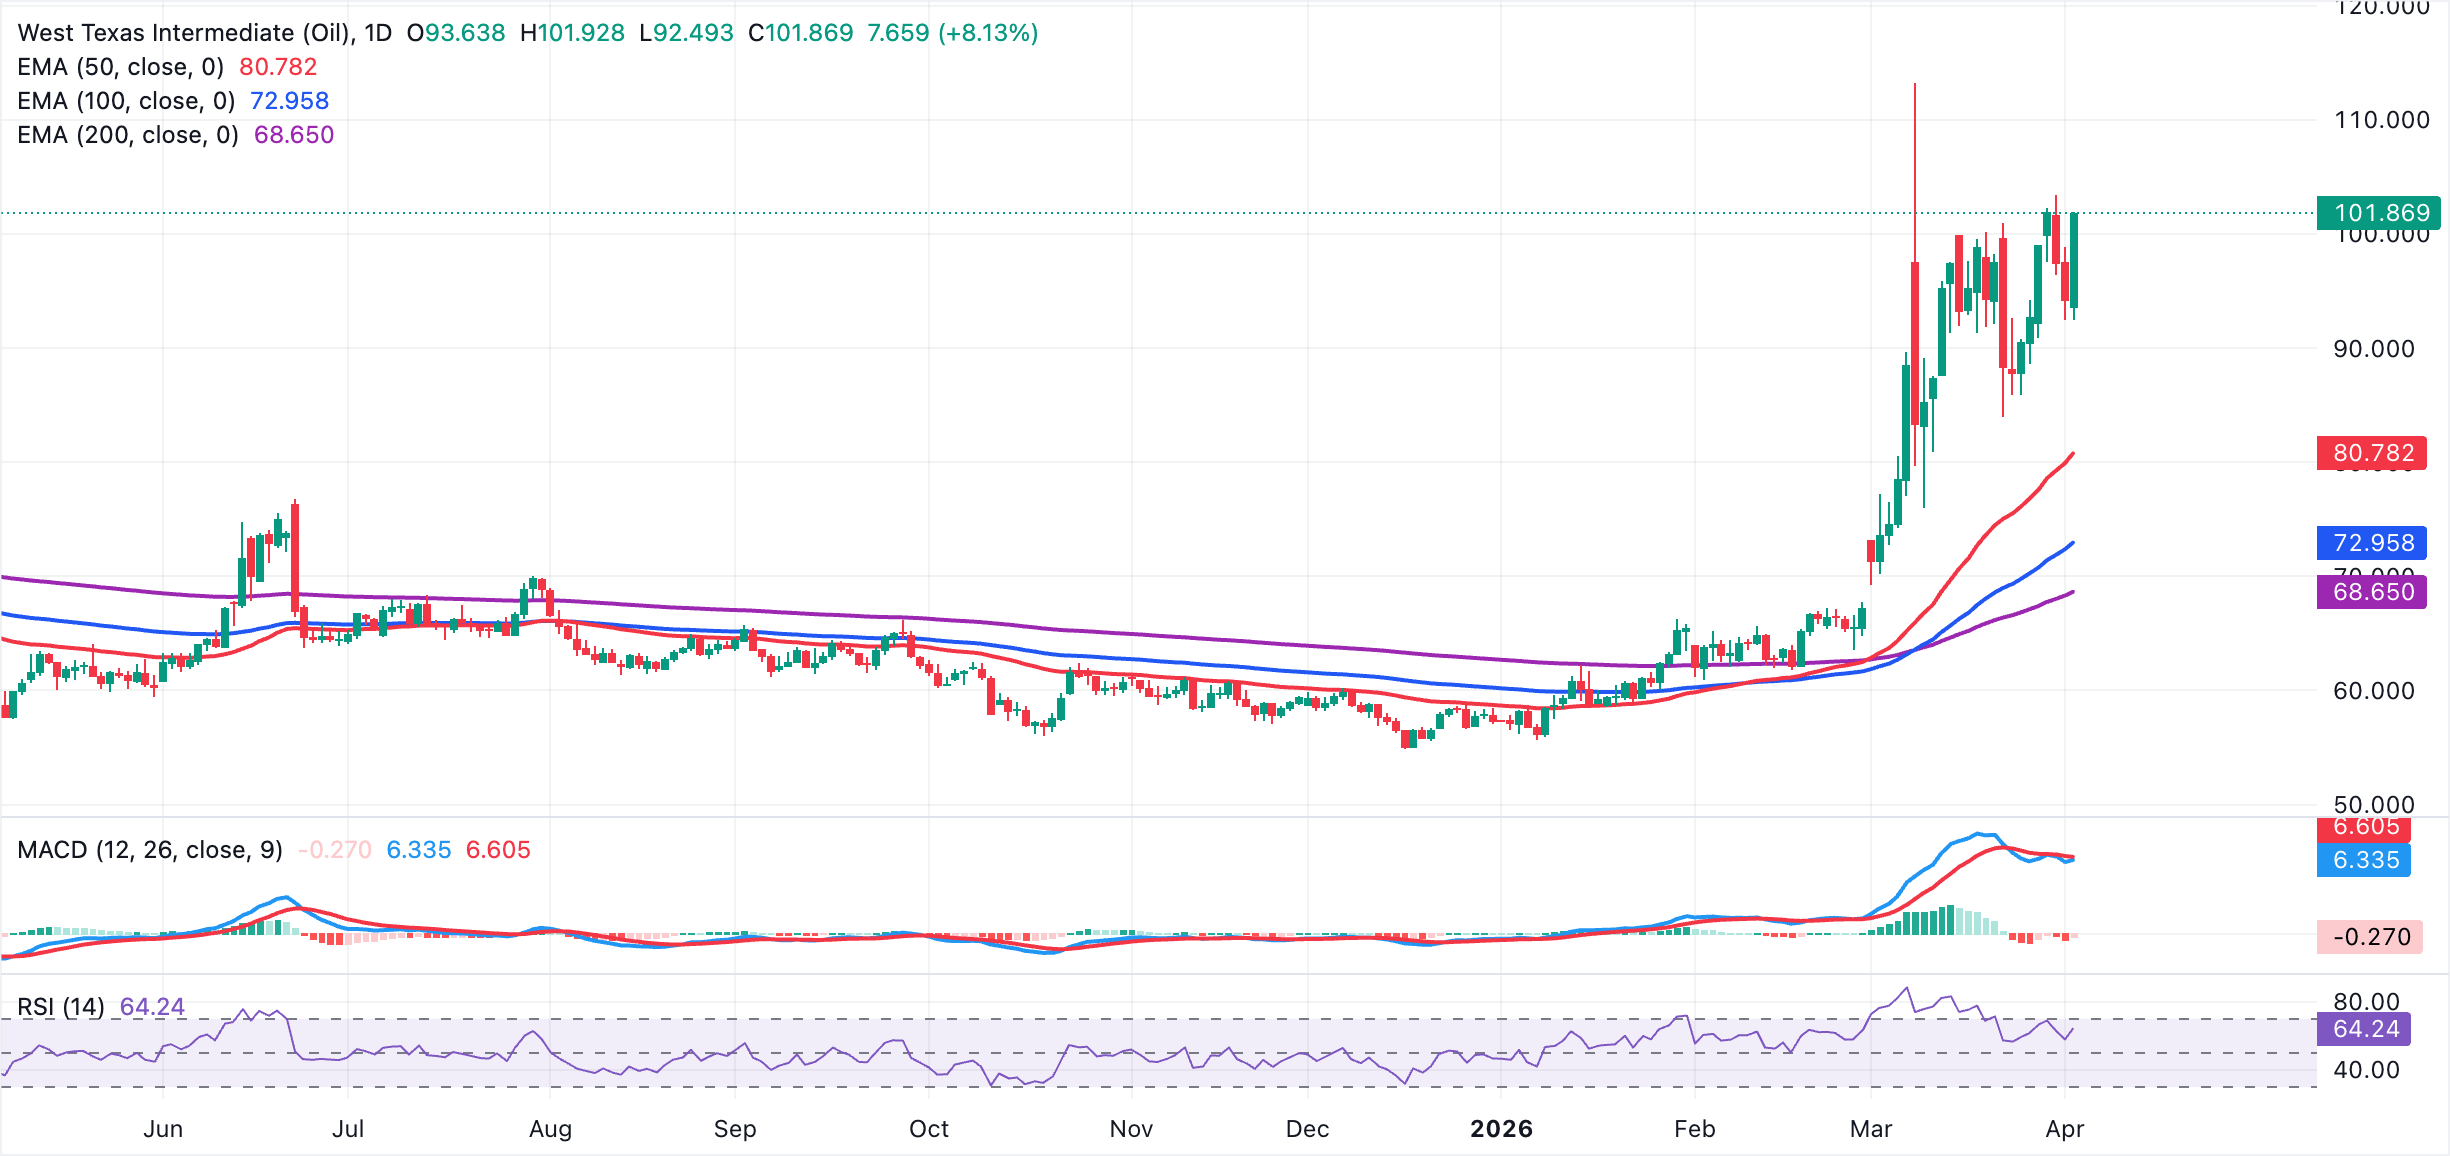
West Texas Intermediate (WTI) Oil price is back above $100, after hitting a daily low below $93. Further escalation of the war could see Oil prices surge, driving macroeconomic uncertainty.
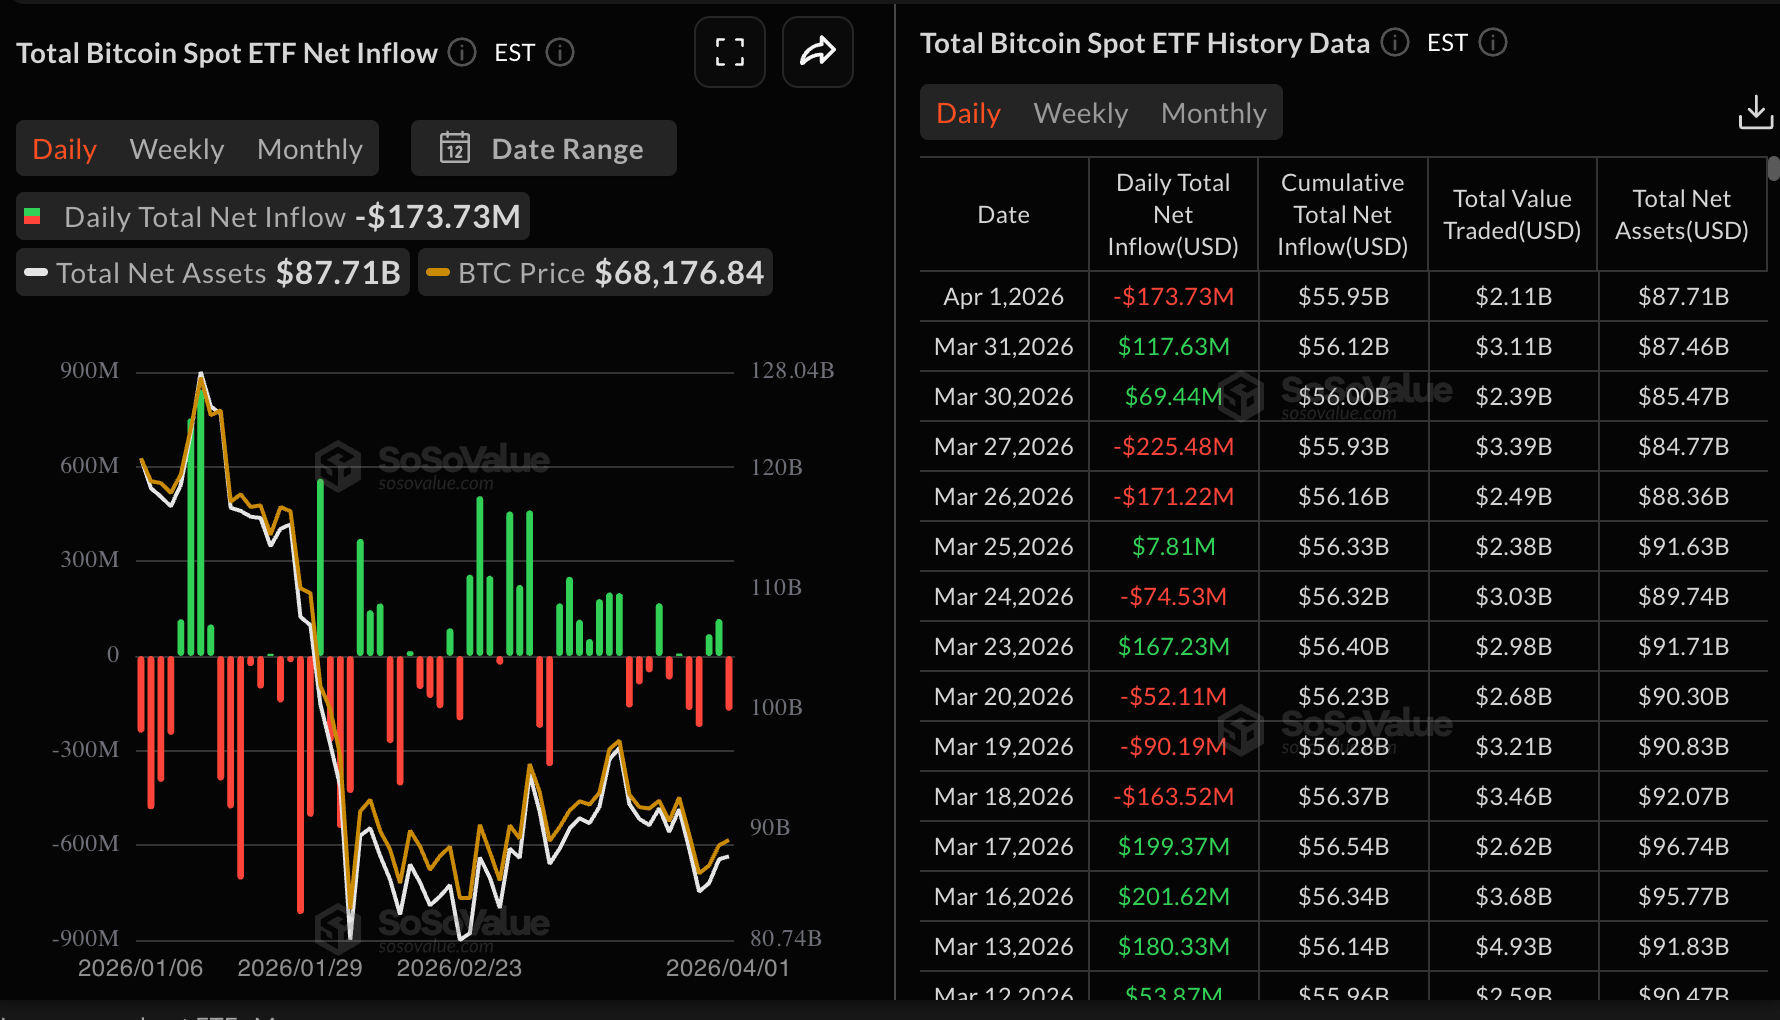
Interest in Bitcoin spot Exchange-Traded Funds (ETFs) wobbled on Wednesday, with outflows totaling nearly $174 million, which broke a two-day bullish streak that had seen inflows of approximately $69 million on Monday and nearly $118 million on Tuesday.
Cumulative inflows stand at $55.95 billion, with net assets under management at $87.71 billion. If outflows persist, they would suggest that sentiment is deteriorating, limiting Bitcoin’s potential recovery.
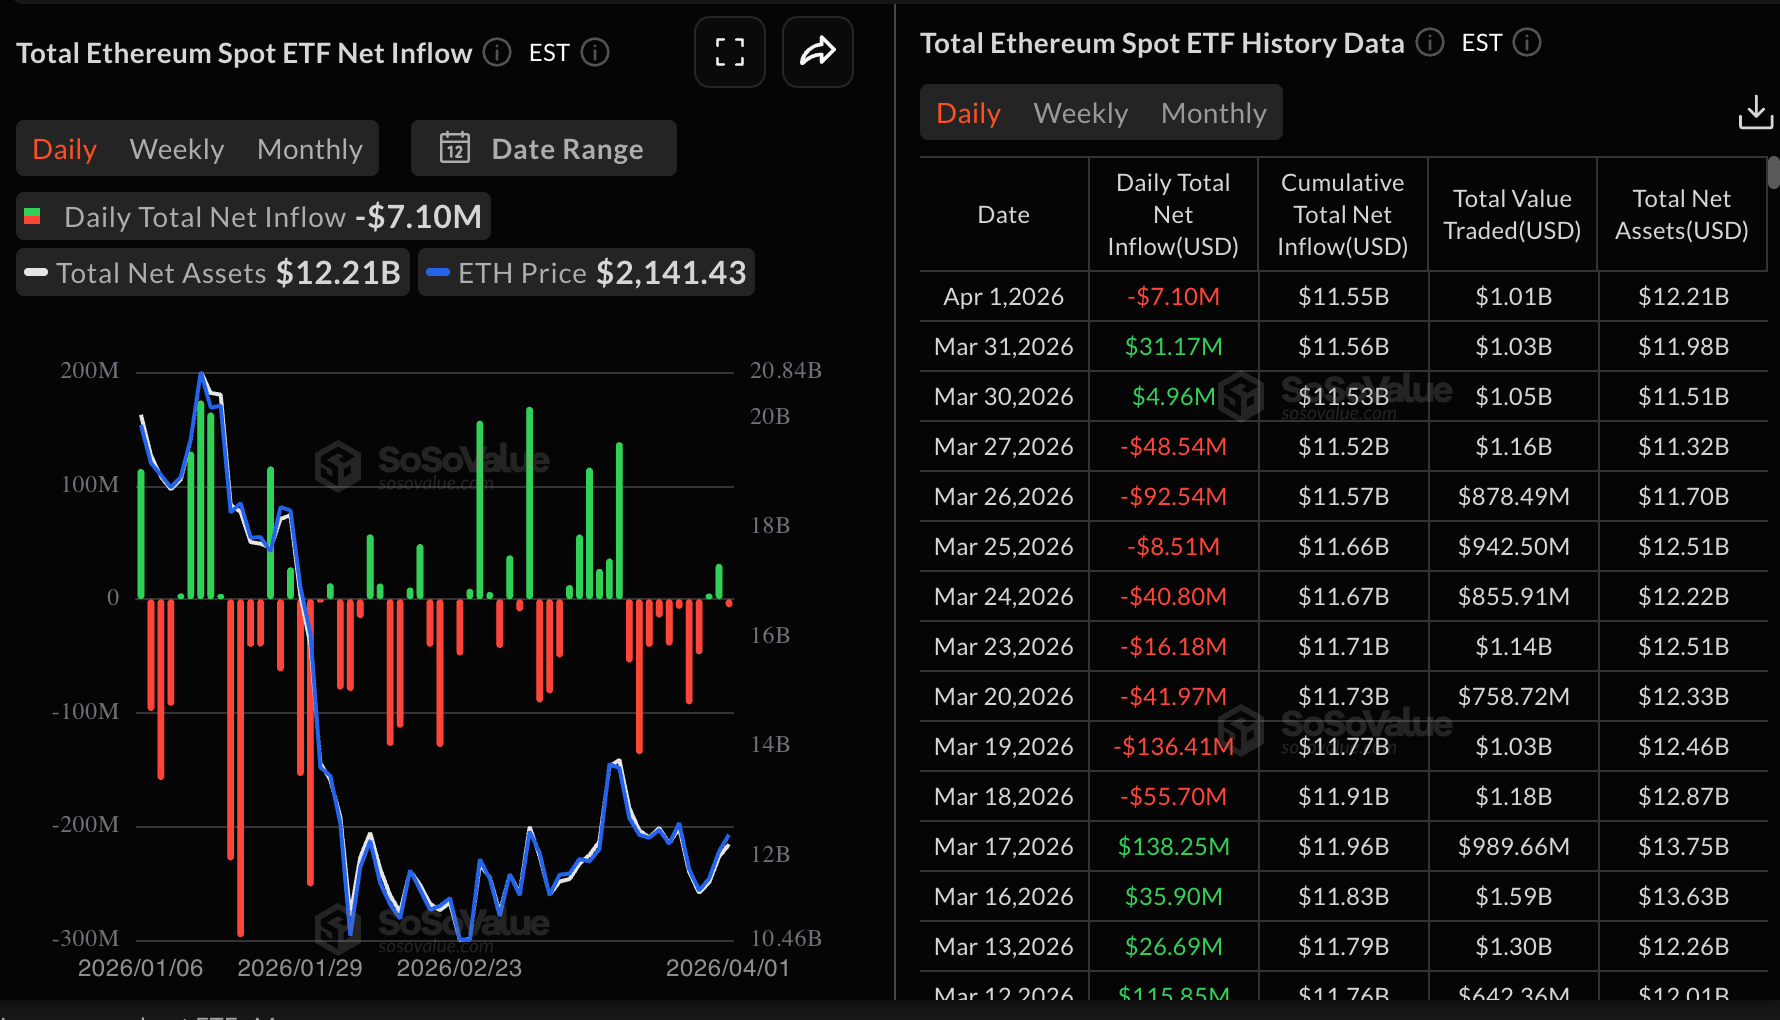
Ethereum ETFs exhibit a similar outlook to Bitcoin, with spot ETFs recording outflows of roughly $7 million on Wednesday. SoSoValue data shows that US-listed ETFs had turned around, attracting roughly $5 million and $31 million in inflows on Monday and Tuesday, respectively. Cumulative inflows stand at $11.55 billion, with net assets under management at $12.21 billion.
Interest in XRP ETFs has deteriorated further, as evidenced by mild outflows of $1.32 million on Wednesday following muted activity on Tuesday. XRP ETFs also recorded outflows of roughly $2.3 million on Monday, undermining risk appetite.
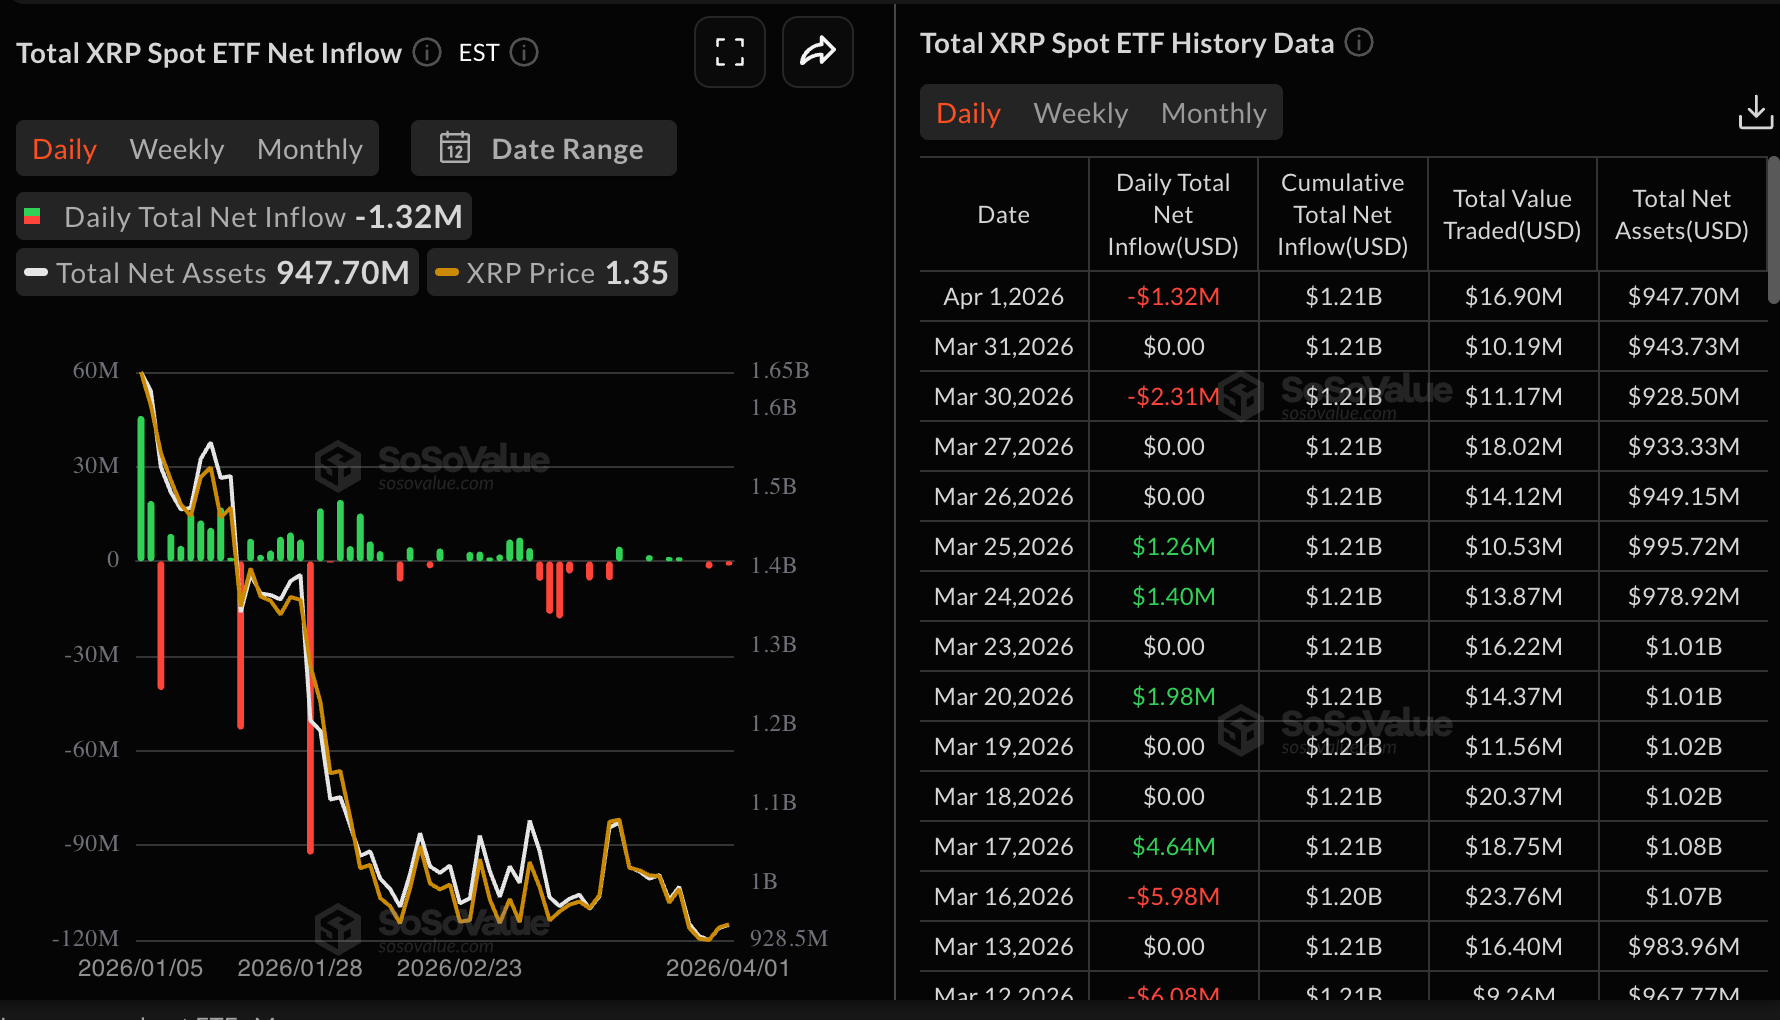
Chart of the day: Bitcoin edges lower amid weakening technicals
Bitcoin (BTC) is trading between $66,000 and $67,000 amid a mildly bearish momentum. The price holds well below the clustered 50-day, 100-day and 200-day Exponential Moving Averages (EMAs), which all descend and cap the upside. The prolonged respect of the downward-sloping resistance trendline keeps the broader structure pressured.
Meanwhile, the Moving Average Convergence Divergence (MACD) indicator is below its signal line on the daily chart, suggesting persistent downside momentum. The Relative Strength Index (RSI) is at 43 points, in sub-50 bearish territory on the same chart, but avoids oversold conditions, consistent with a grinding correction rather than capitulation.
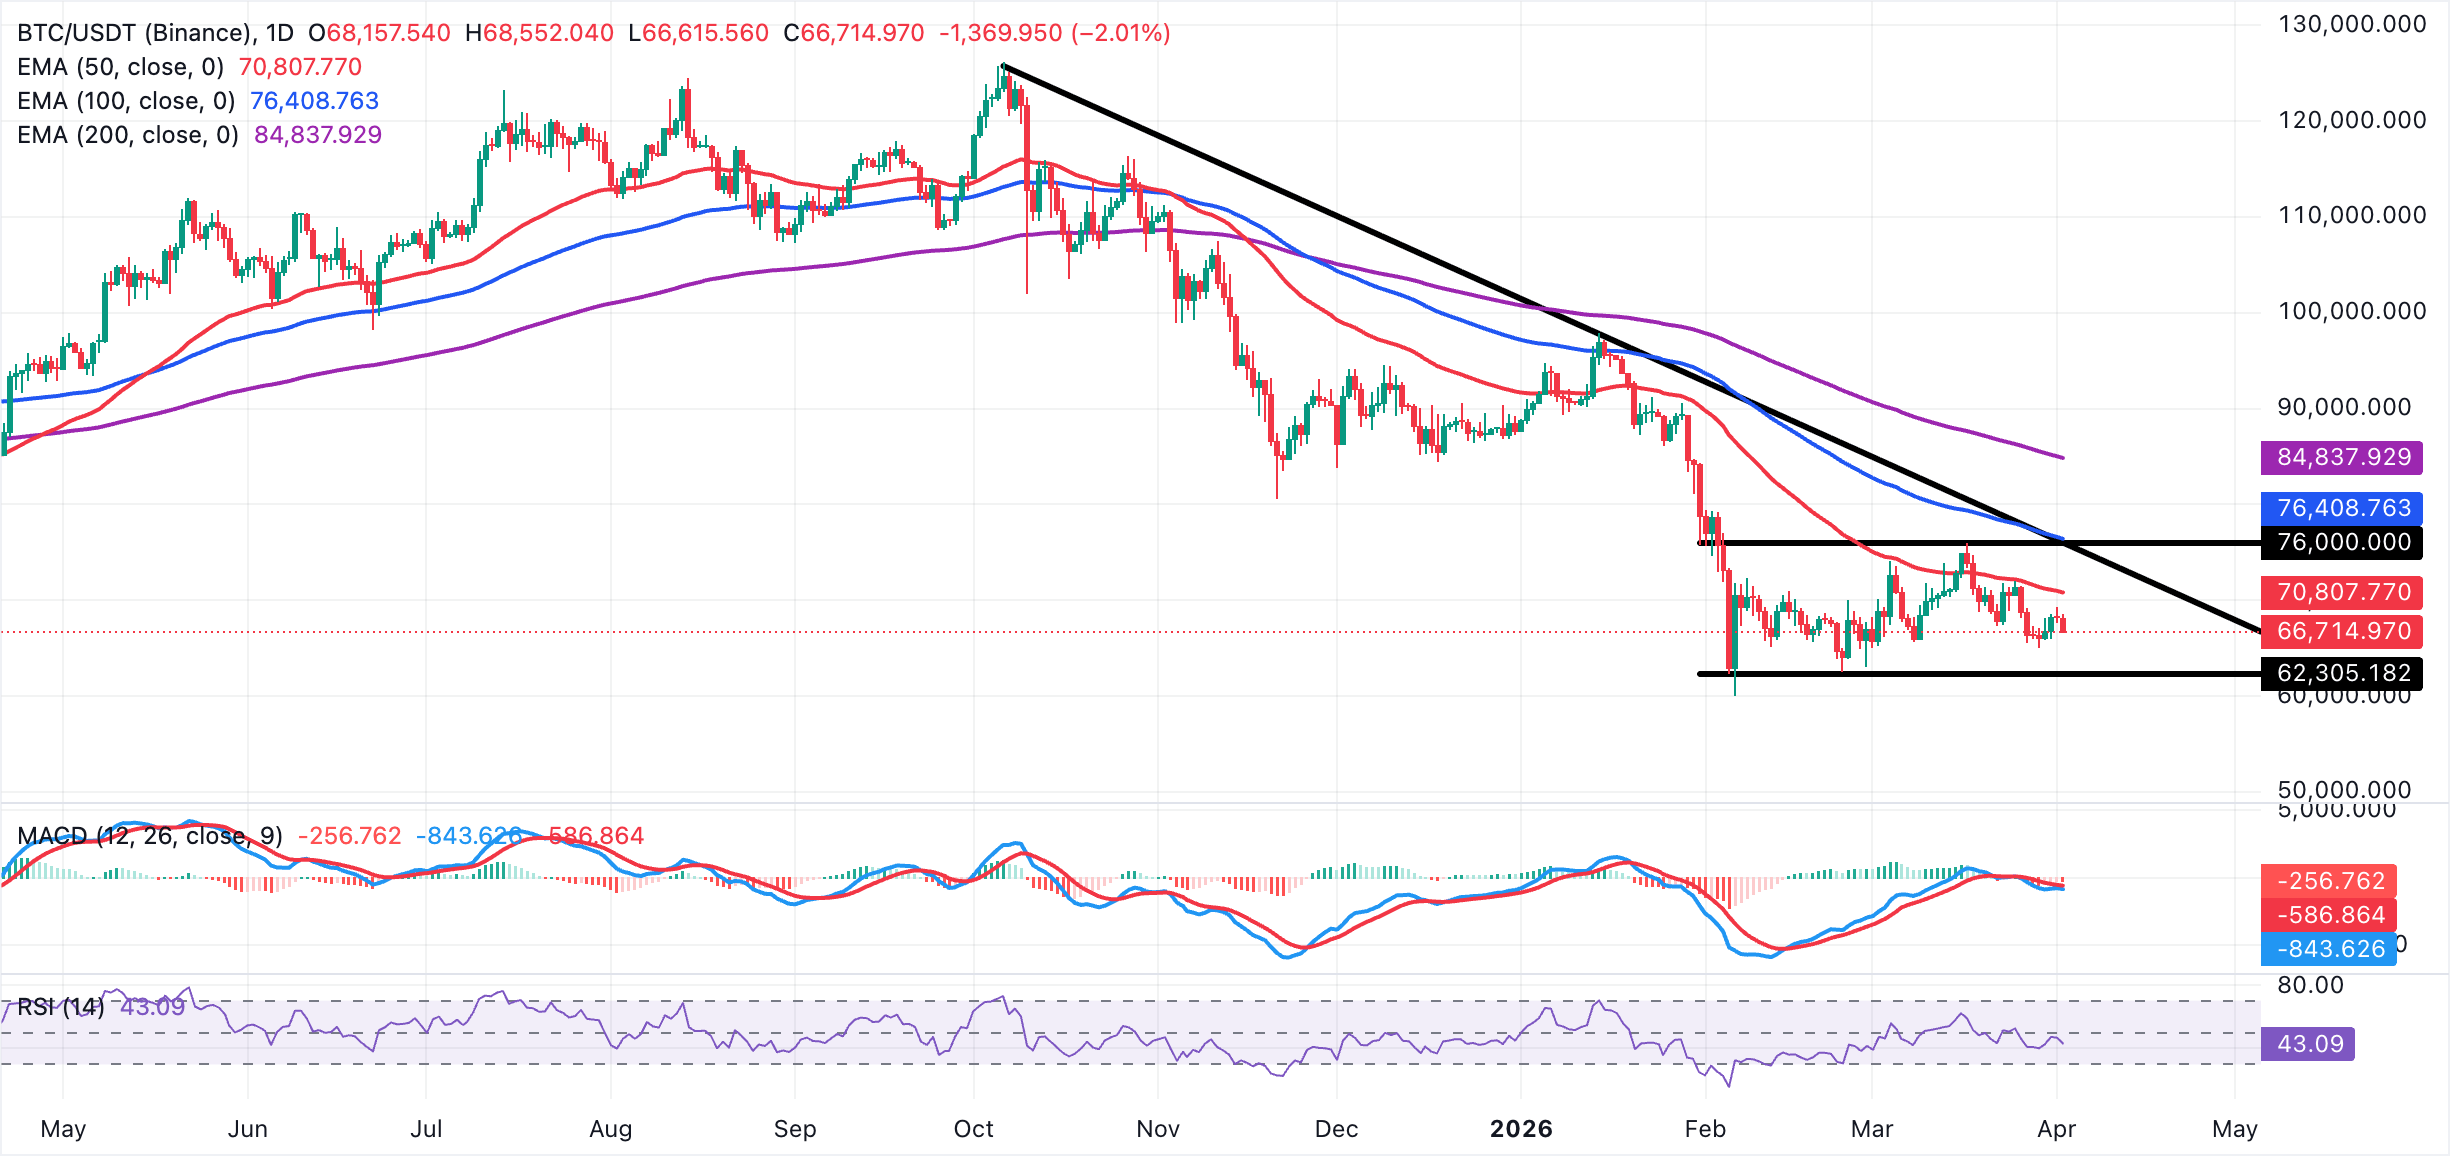
Bitcoin's immediate support emerges near $66,000, the recent closing base, with a break exposing the next downside area around $65,000, where prior reaction lows cluster. Below that, deeper weakness could target the $62,300 area as the next logical technical floor. On the upside, initial resistance aligns with $68,300–$68,500, followed by the 50-day EMA around $70,800. A daily close above $71,800 would be needed to challenge the 100-day EMA at $76,409.
Altcoins technical update: Ethereum and XRP pressured as declines extend
Ethereum is trading above the $2,000 pivotal level after correcting from its week's high of $ 2,168. The near-term bias is mildly bearish as price holds below the clustered 50-day, 100-day and 200-day EMAs, which all track well above $2,150 and frame a dominant medium-term downtrend.
The long-standing descending resistance trendline continues to cap the broader structure despite the recent bounce, while the MACD indicator remains below its signal line on the daily chart, suggesting weak downside momentum rather than an impulsive selloff. At the same time, the RSI around the mid-40s on the same chart reinforces a lack of strong buying interest and aligns with a soft, corrective tone within a broader bearish context.
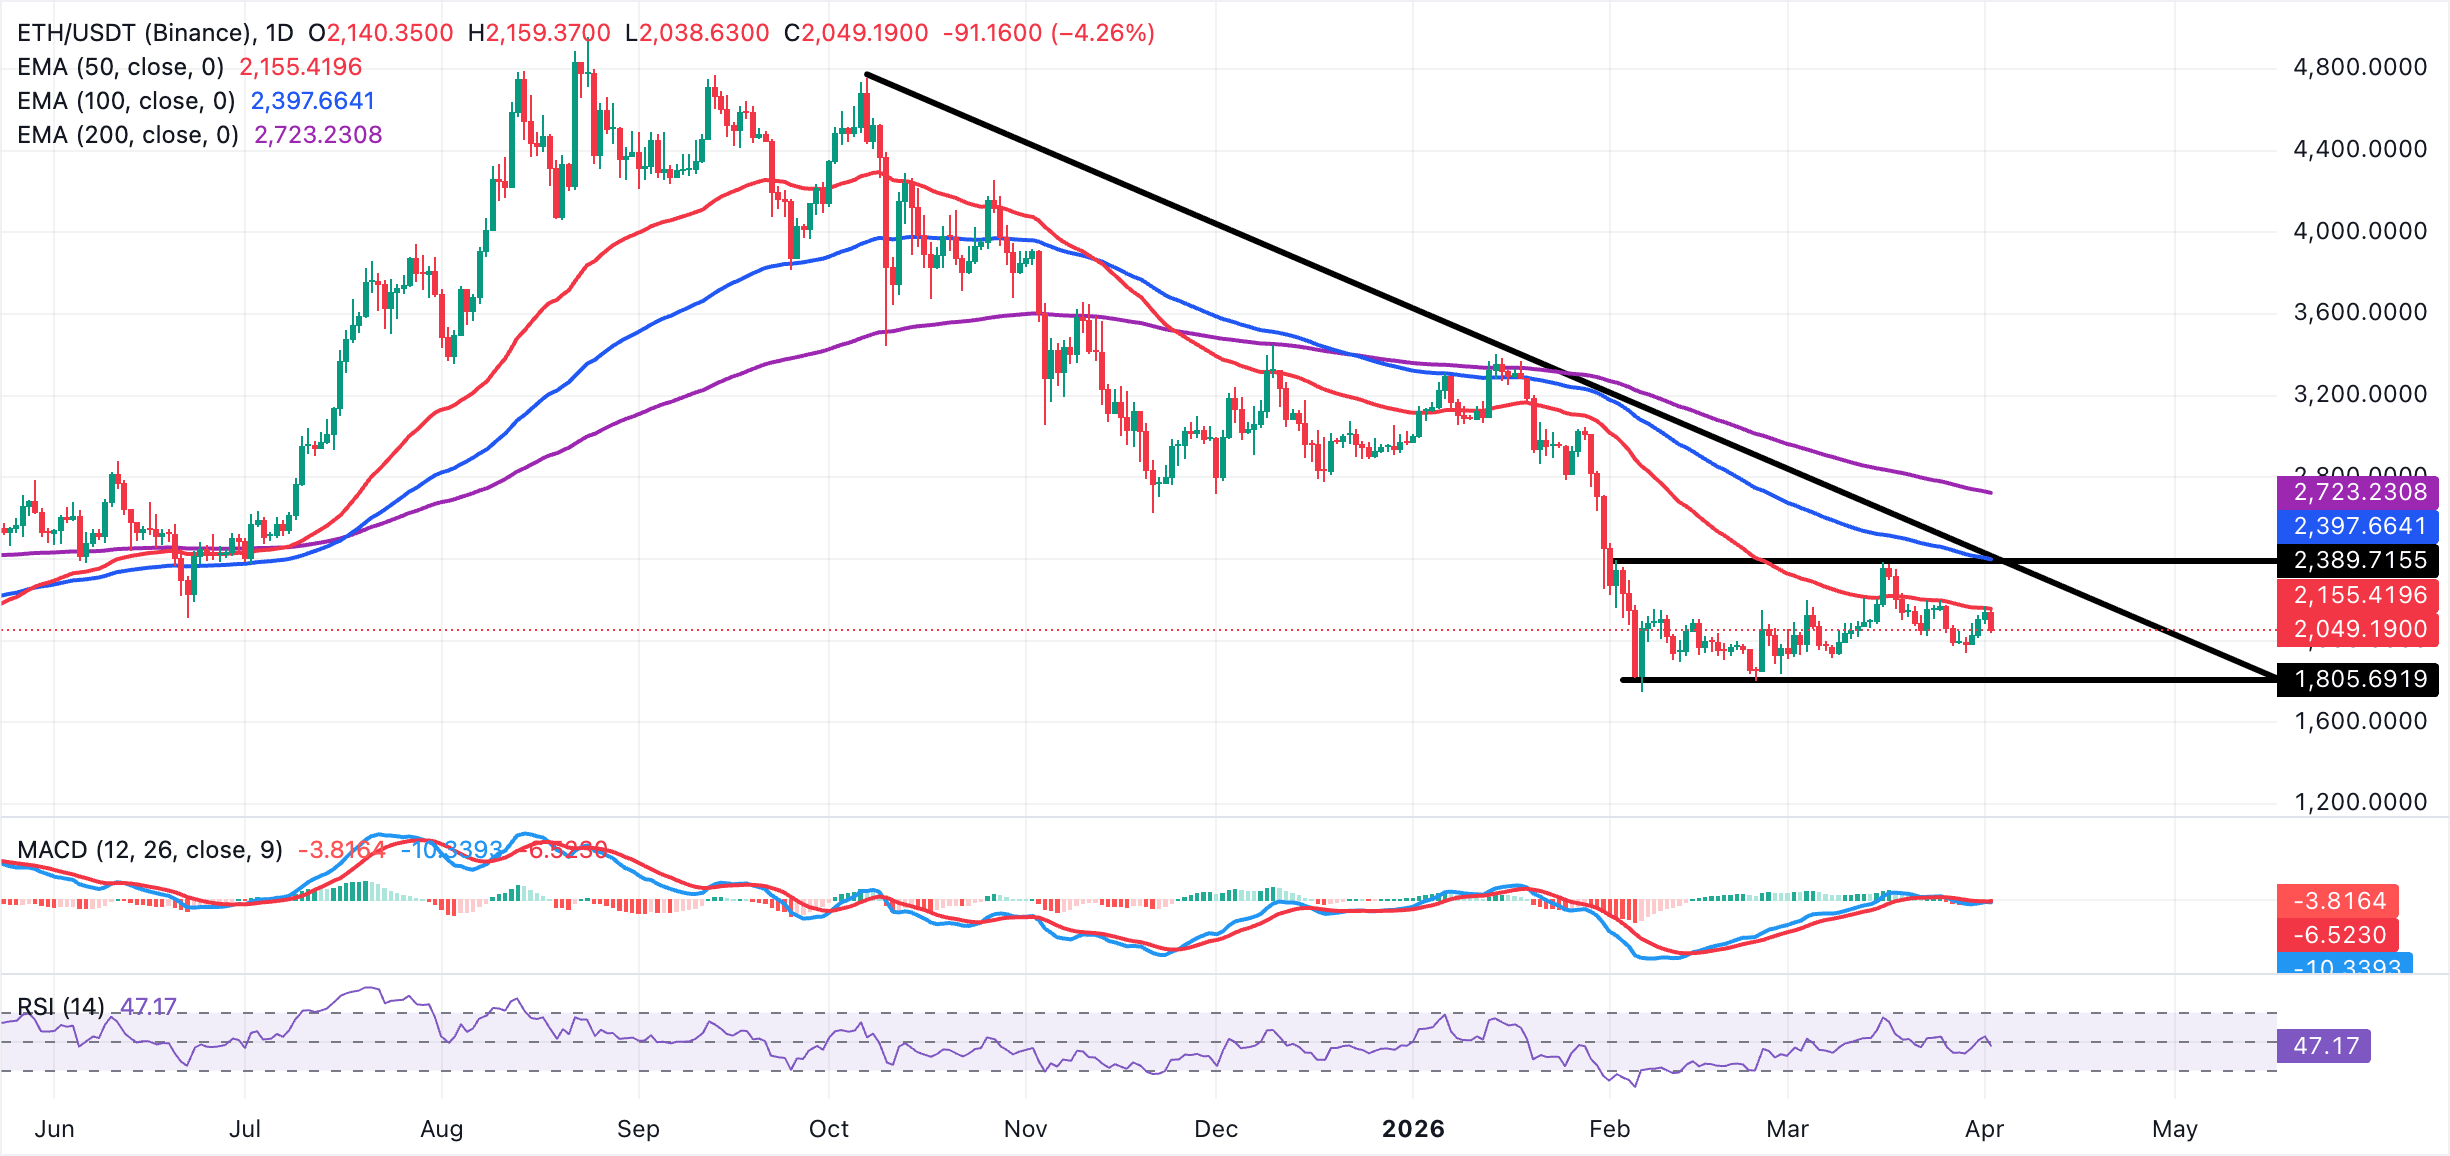
Ethereum's initial resistance emerges near $2,140, where recent swing highs converge with the 50-day EMA. A break above that supply range would expose the next hurdle at $2,200, followed by $2,350. On the downside, immediate support is seen around $2,000, guarding the mid-$1,900s congestion band. A clear drop through $1,900 would reopen the path toward $1,850 as the next lower support area.
As for XRP, its near-term bias is mildly bearish, as price holds below the descending resistance trend line, which was last rejected near $1.61, and continues to compress under it. Daily closes remain well below the 50-day, 100-day, and 200-day EMAs, which are clustered between roughly $1.44 and $1.87, reinforcing a dominant downside context despite the recent stabilization.
The MACD indicator is below its signal line and has slipped back under the zero line on the daily chart, with red histogram bars, suggesting sellers retain momentum. Moreover, the RSI at 38 on the same chart signals weak demand and aligns with a market leaning toward downside continuation rather than a sustained bounce.
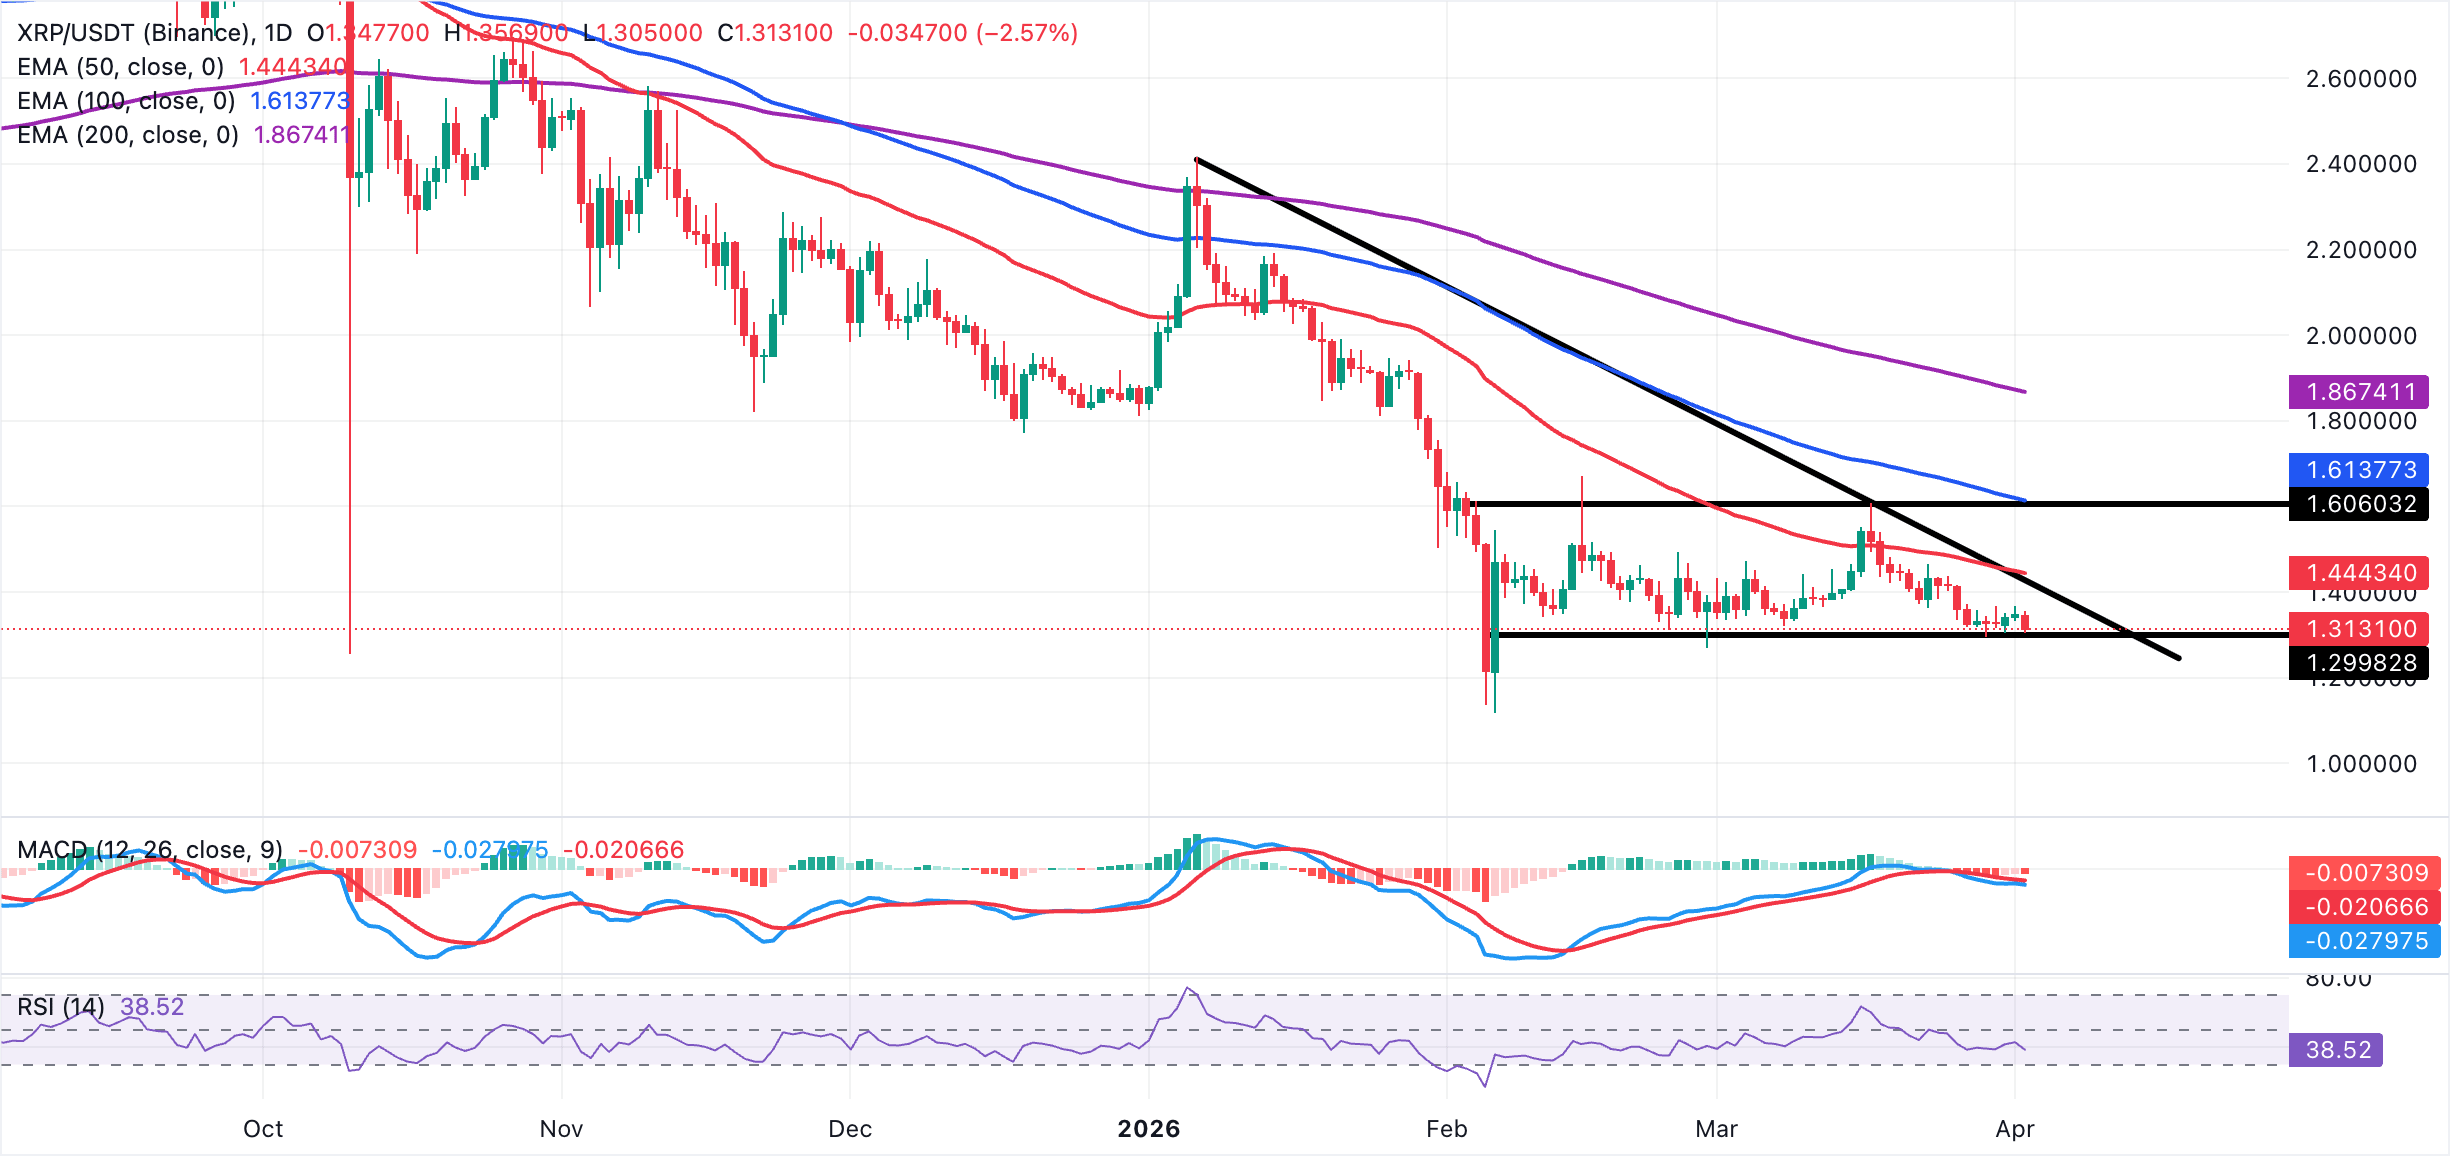
XRP's initial resistance aligns with recent reaction highs around $1.34, followed by $1.36 and then $1.41, where prior daily peaks coincide with proximity to the declining short-term average band. A daily close above $1.41 would be needed to ease bearish pressure and open the way toward the stronger cap at $1.45. On the downside, immediate support is at the current trough zone near $1.30, with a break lower exposing $1.28 as the next bearish target.
Crypto ETF FAQs
An Exchange-Traded Fund (ETF) is an investment vehicle or an index that tracks the price of an underlying asset. ETFs can not only track a single asset, but a group of assets and sectors. For example, a Bitcoin ETF tracks Bitcoin’s price. ETF is a tool used by investors to gain exposure to a certain asset.
Yes. The first Bitcoin futures ETF in the US was approved by the US Securities & Exchange Commission in October 2021. A total of seven Bitcoin futures ETFs have been approved, with more than 20 still waiting for the regulator’s permission. The SEC says that the cryptocurrency industry is new and subject to manipulation, which is why it has been delaying crypto-related futures ETFs for the last few years.
Yes. The SEC approved in January 2024 the listing and trading of several Bitcoin spot Exchange-Traded Funds, opening the door to institutional capital and mainstream investors to trade the main crypto currency. The decision was hailed by the industry as a game changer.
The main advantage of crypto ETFs is the possibility of gaining exposure to a cryptocurrency without ownership, reducing the risk and cost of holding the asset. Other pros are a lower learning curve and higher security for investors since ETFs take charge of securing the underlying asset holdings. As for the main drawbacks, the main one is that as an investor you can’t have direct ownership of the asset, or, as they say in crypto, “not your keys, not your coins.” Other disadvantages are higher costs associated with holding crypto since ETFs charge fees for active management. Finally, even though investing in ETFs reduces the risk of holding an asset, price swings in the underlying cryptocurrency are likely to be reflected in the investment vehicle too.
(The technical analysis of this story was written with the help of an AI tool.)
Author

John Isige
FXStreet
John Isige is a seasoned cryptocurrency journalist and markets analyst committed to delivering high-quality, actionable insights tailored to traders, investors, and crypto enthusiasts. He enjoys deep dives into emerging Web3 tren




