Crypto Today: Bitcoin, Ethereum, XRP struggle for direction as US-Iran war fuels volatility
- Bitcoin trades sideways around the pivotal $70,000 level as Oil prices increase, driven by the escalation of the US-Iran war.
- Ethereum remains rangebound below resistance around $2,150, weighed down by declining futures Open Interest.
- XRP declines for the second consecutive day amid muted institutional interest.

The cryptocurrency market remains on edge, restraining upside action as the United States (US)-Iran war rages on in the Middle East. Bitcoin (BTC) has slipped to trade around the pivotal $70,000 level at the time of writing on Thursday, while Ethereum (ETH) holds above the key $2,000 level.
Meanwhile, Ripple (XRP) hovers around $1.38, weighed down by low institutional interest and jitters over the Middle East war and its potential to negatively impact the global economy.
US-Iran war rages on as Oil prices climb
US President Donald Trump maintains that the war in Iran will end “soon,” even as strikes on the Islamic Republic continue. Iran has also been relentless in its quest to retaliate against the US and Israel, focusing on disrupting global Oil supplies.
Despite Trump’s warning that Iran should refrain from attacking ships on transit, suspected Iranian drones have hit at least three ships in and around the Strait of Hormuz, according to CBS News.
The attacks on shipping vessels and energy hubs appear to be sending jitters in global markets, with WTI Oil prices advancing for three consecutive days and rising above $90 on Thursday from a Tuesday low of $76.
-1773309094666-1773309094677.png)
It is worth noting that despite the US-Iran war entering its 13th day, crypto prices have not collapsed, suggesting that investors could be considering high-risk assets such as Bitcoin as potential hedges against geopolitical tensions.
Chart of the day: Bitcoin steadies but upside remains limited
Bitcoin is holding above $70,000 but holds below the upper end of the range with resistance at $72,271, aligning with the February 8 high. Above this key level is the 50-day Exponential Moving Average (EMA) at $72,929, which continues to cap rebounds.
A sustainable break above that supply cluster is required to steady Bitcoin’s recovery toward the 100-day EMA at $80,049 and then the 200-day EMA at $88,270.
Meanwhile, the near-term bias is neutral with a slight bullish tilt as the Moving Average Convergence Divergence (MACD) indicator remains above its signal line on the daily chart. Green histogram bars appear to be fading, suggesting cooling bullish momentum. Moreover, the Relative Strength Index (RSI) near 51 remains neutral on the same chart, suggesting a range-bound phase rather than a decisive breakout.
Bitcoin price also holds below the 50-day, 100-day and 200-day EMAs, keeping the broader trend bearish despite the recent consolidation above the year-low at $60,000.
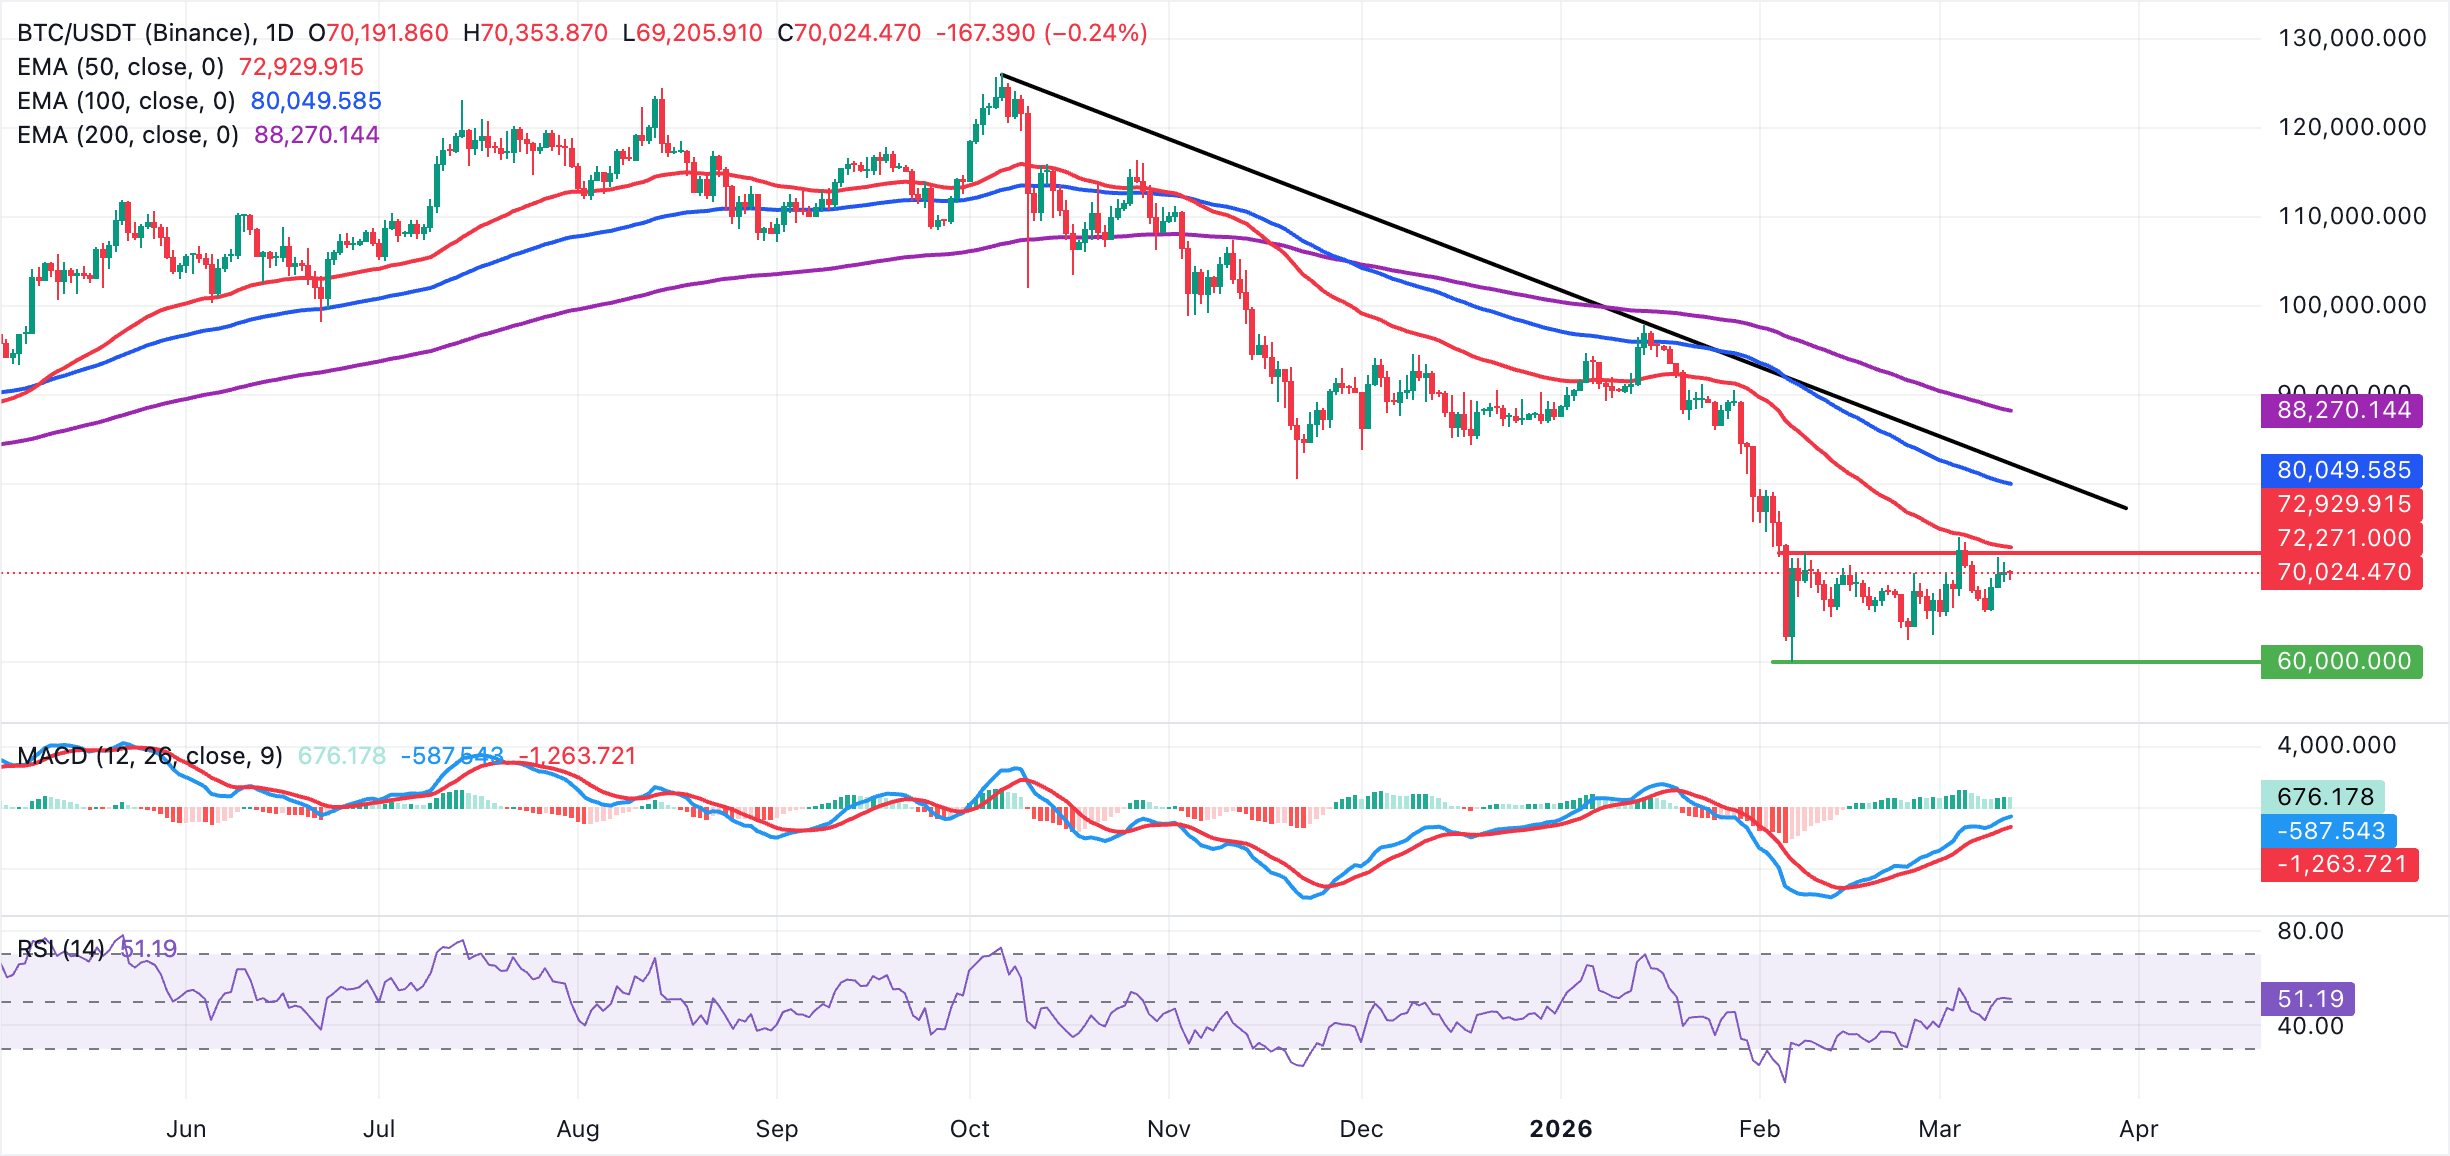
On the downside, immediate support is seen near $68,300, guarding last week’s pullback base ahead of a deeper floor around $66,000, where recent lows cluster and buyers have repeatedly emerged. A break below $66,000 would expose the lower band of the consolidation near $64,000, while holding above $68,300 keeps the door open for another test of the $72,271 resistance zone.
Altcoins update: Ethereum and XRP hold key support
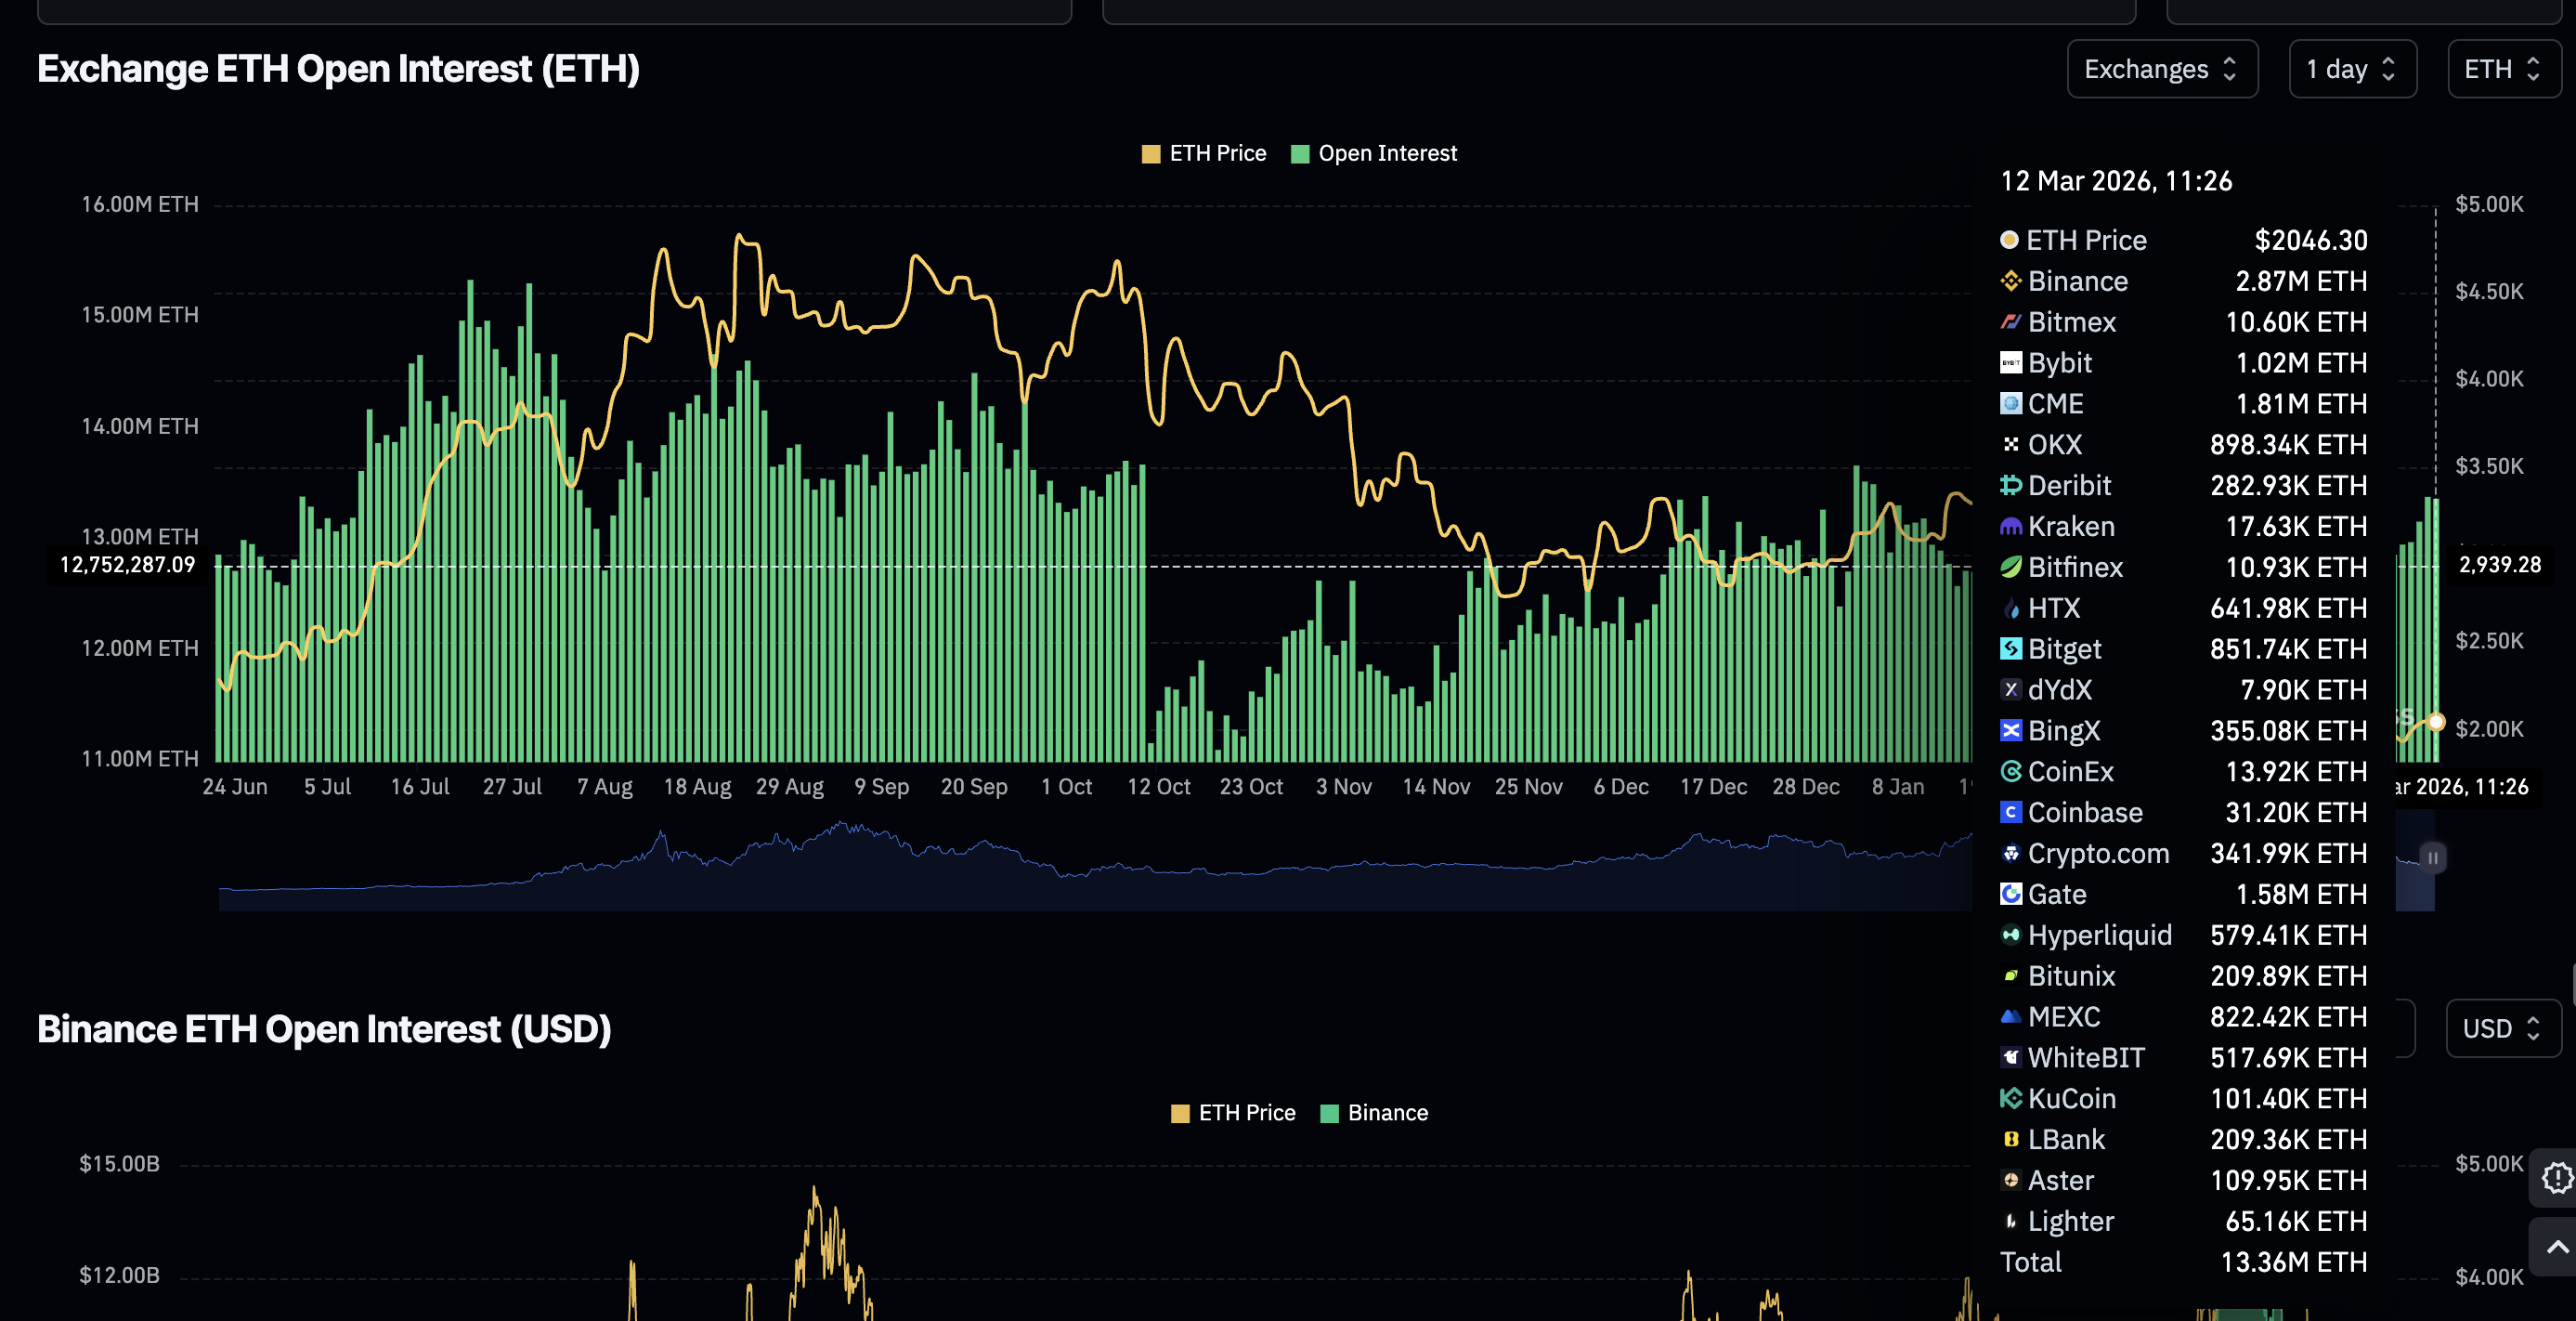
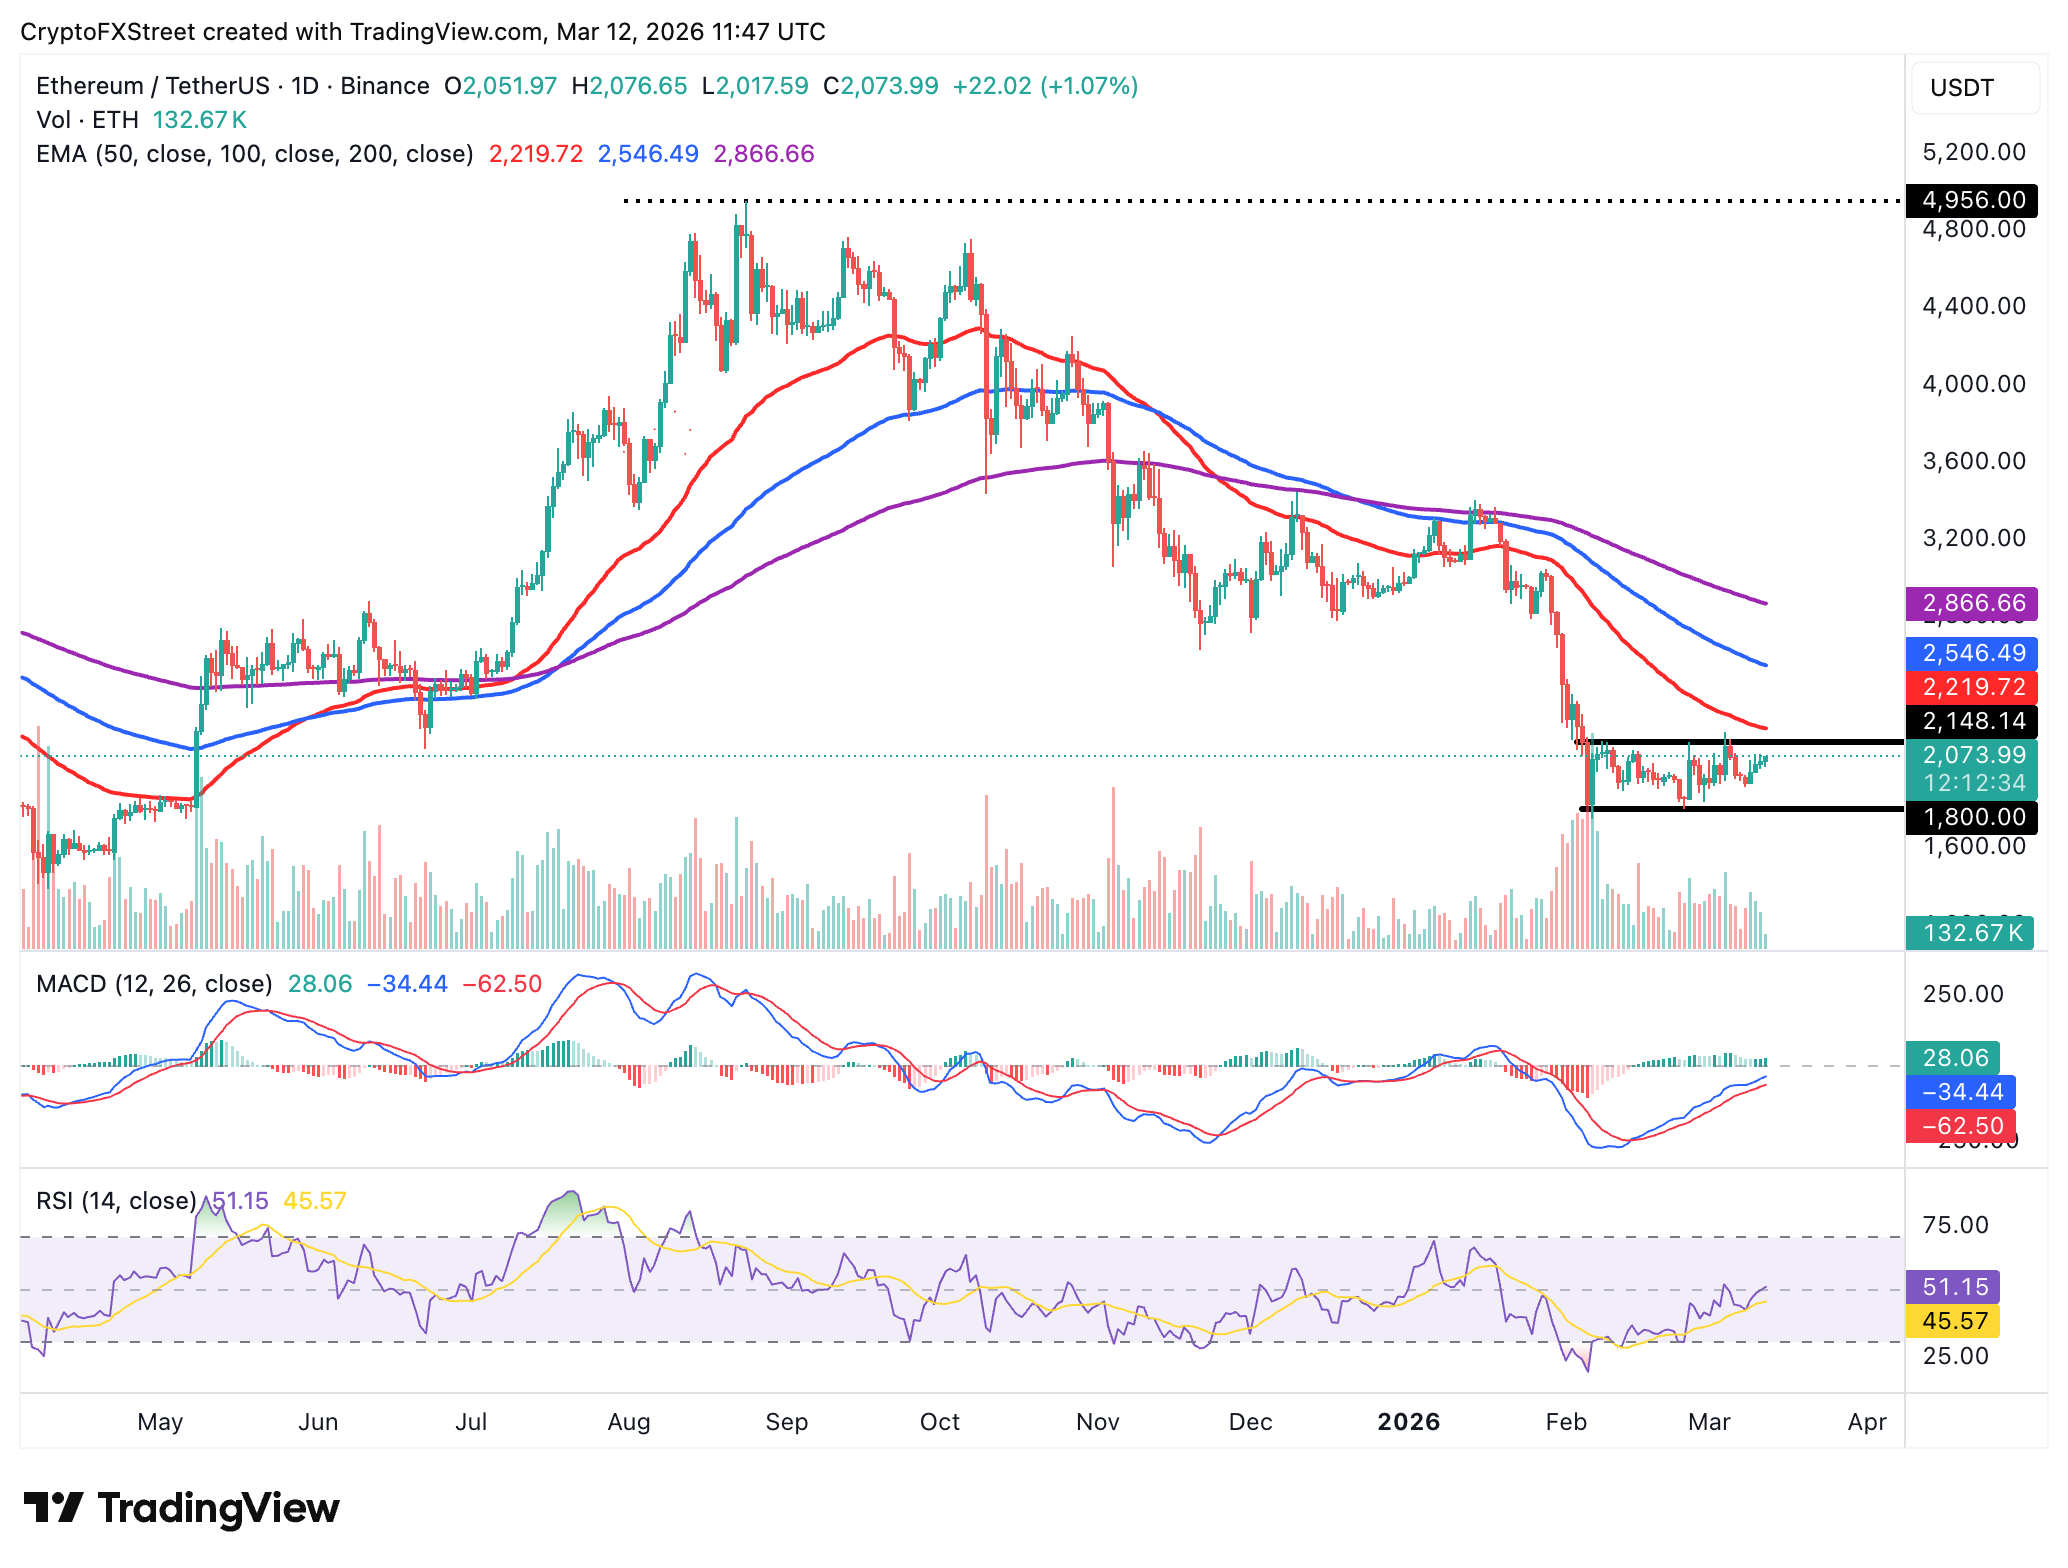
Ethereum is trading above $2,000 with its upside capped near the range high at $2,150. Extended macroeconomic uncertainty, geopolitical tensions, and low retail demand are among the factors that continue to weigh on the leading altcoin. CoinGlass data shows the Ethereum futures Open Interest (OI) narrowing to 13.36 million ETH on Thursday, from 13.37 million the previous day. In contrast, the OI peaked at 15.33 million ETH in July, undermining the current retail interest in the smart contract token. A persistently declining OI suggests that traders are losing confidence in Ethereum's ability to sustain an uptrend.
Meanwhile, the near-term technical bias remains bearish, with the price below the clustered 50-day, 100-day and 200-day EMAs between roughly $2,218 and $2,867. This outlook keeps ETH entrenched in a broader downtrend despite recent stabilization.
Momentum remains fragile with the MACD line holding above its signal line on the daily chart. The RSI near 51 on the same chart indicates neutral momentum after recovering from oversold conditions, suggesting a consolidative phase within a technically weak backdrop.
Initial resistance emerges at $2,150, the recent swing high, followed by the $2,219 area where the 50-day EMA caps the upside and reinforces the broader bearish structure. A daily close above that supply zone would open the door toward the 100-day EMA at $2,546 and the descending trendline.
On the downside, immediate support is seen near $1,940, the recent reaction low, with a break below it exposing $1,860 and then $1,820 as deeper supports within this corrective leg. As long as ETH trades below the $2,219–2,546 resistance band, rallies would remain vulnerable to renewed selling pressure.
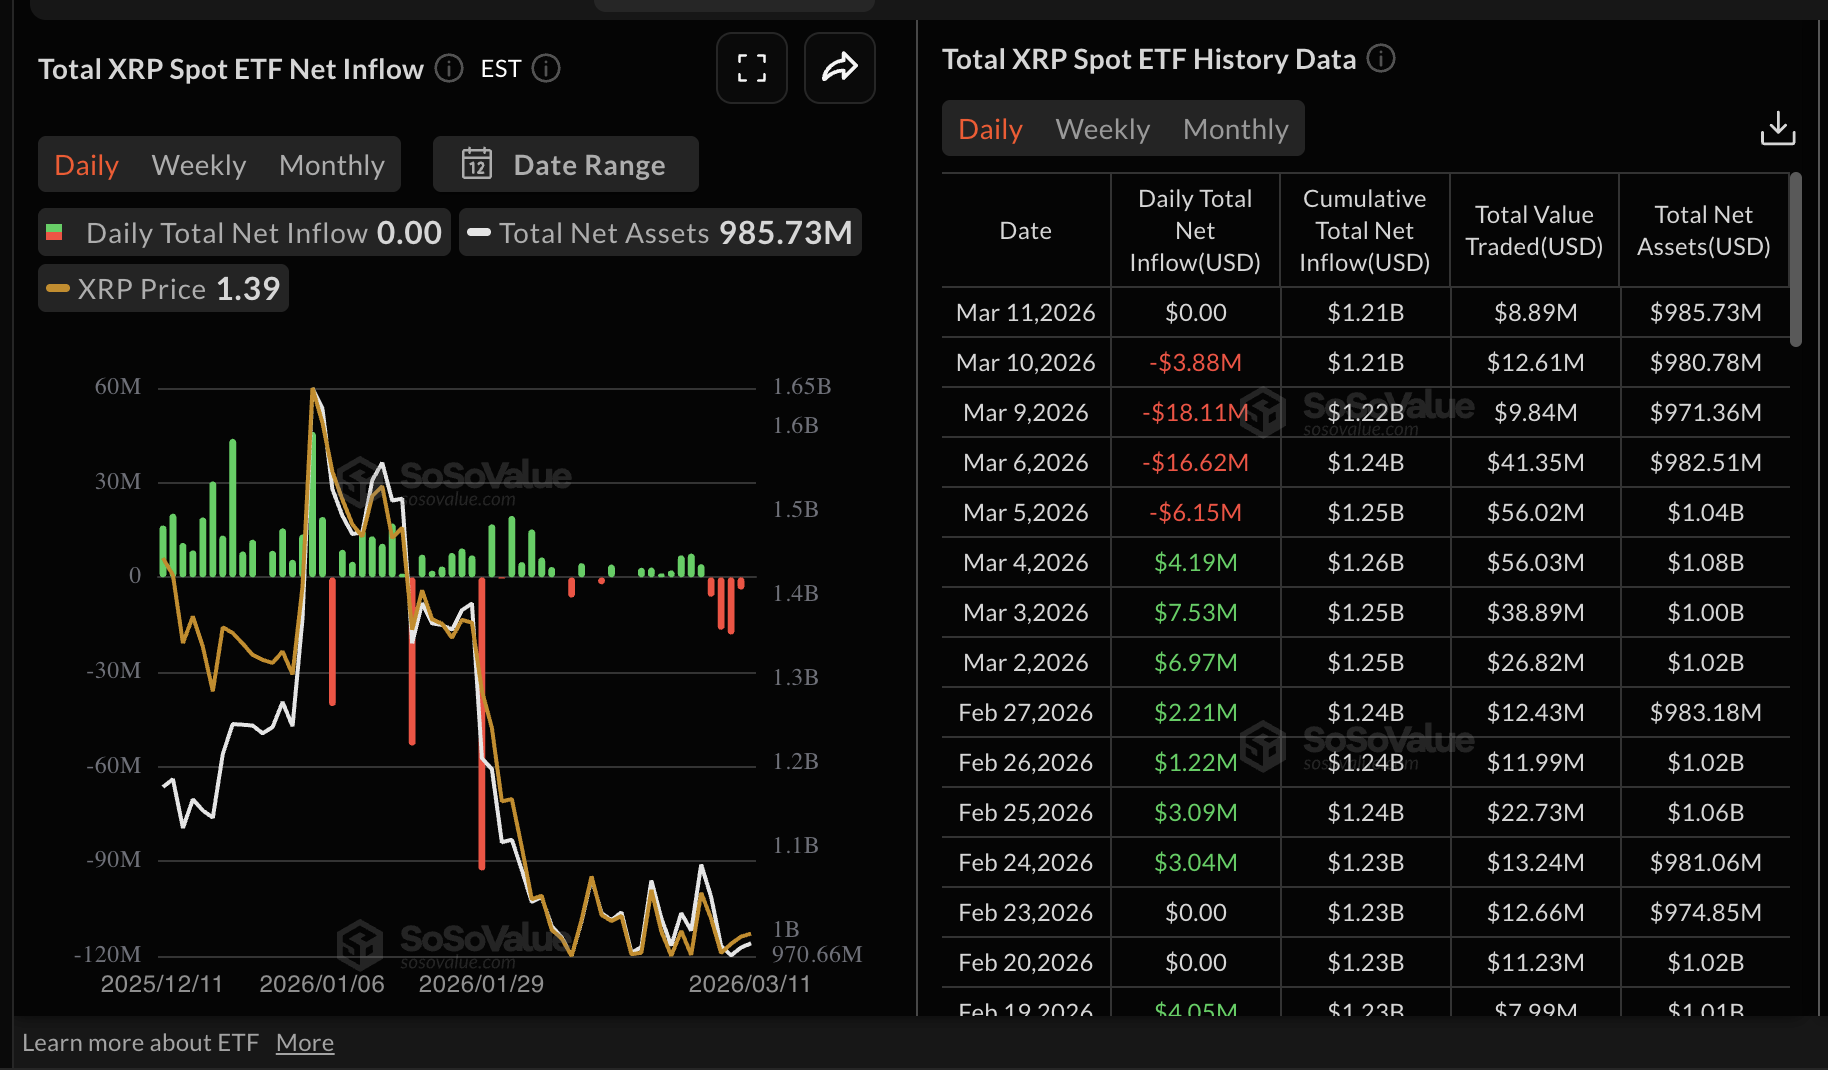
As for XRP, institutional activity remained muted on Wednesday, as spot Exchange Traded Funds (ETFs) closed with zero flows, according to SoSoValue data. Cumulative inflows stand at $1.21 billion, and net assets under management are approximately $986 million, despite fading investor interest.
XRP’s technical outlook remains largely bearish, trading around the daily open of $1.38 at the time of writing on Thursday. The 50-day, 100 and 200-day EMAs clustered between $1.52 and $1.98, limiting XRP’s upside. At the same time, the RSI at 45 is below the 50 midline on the daily chart, underscoring neutrality and a lagging shift toward bullishness.
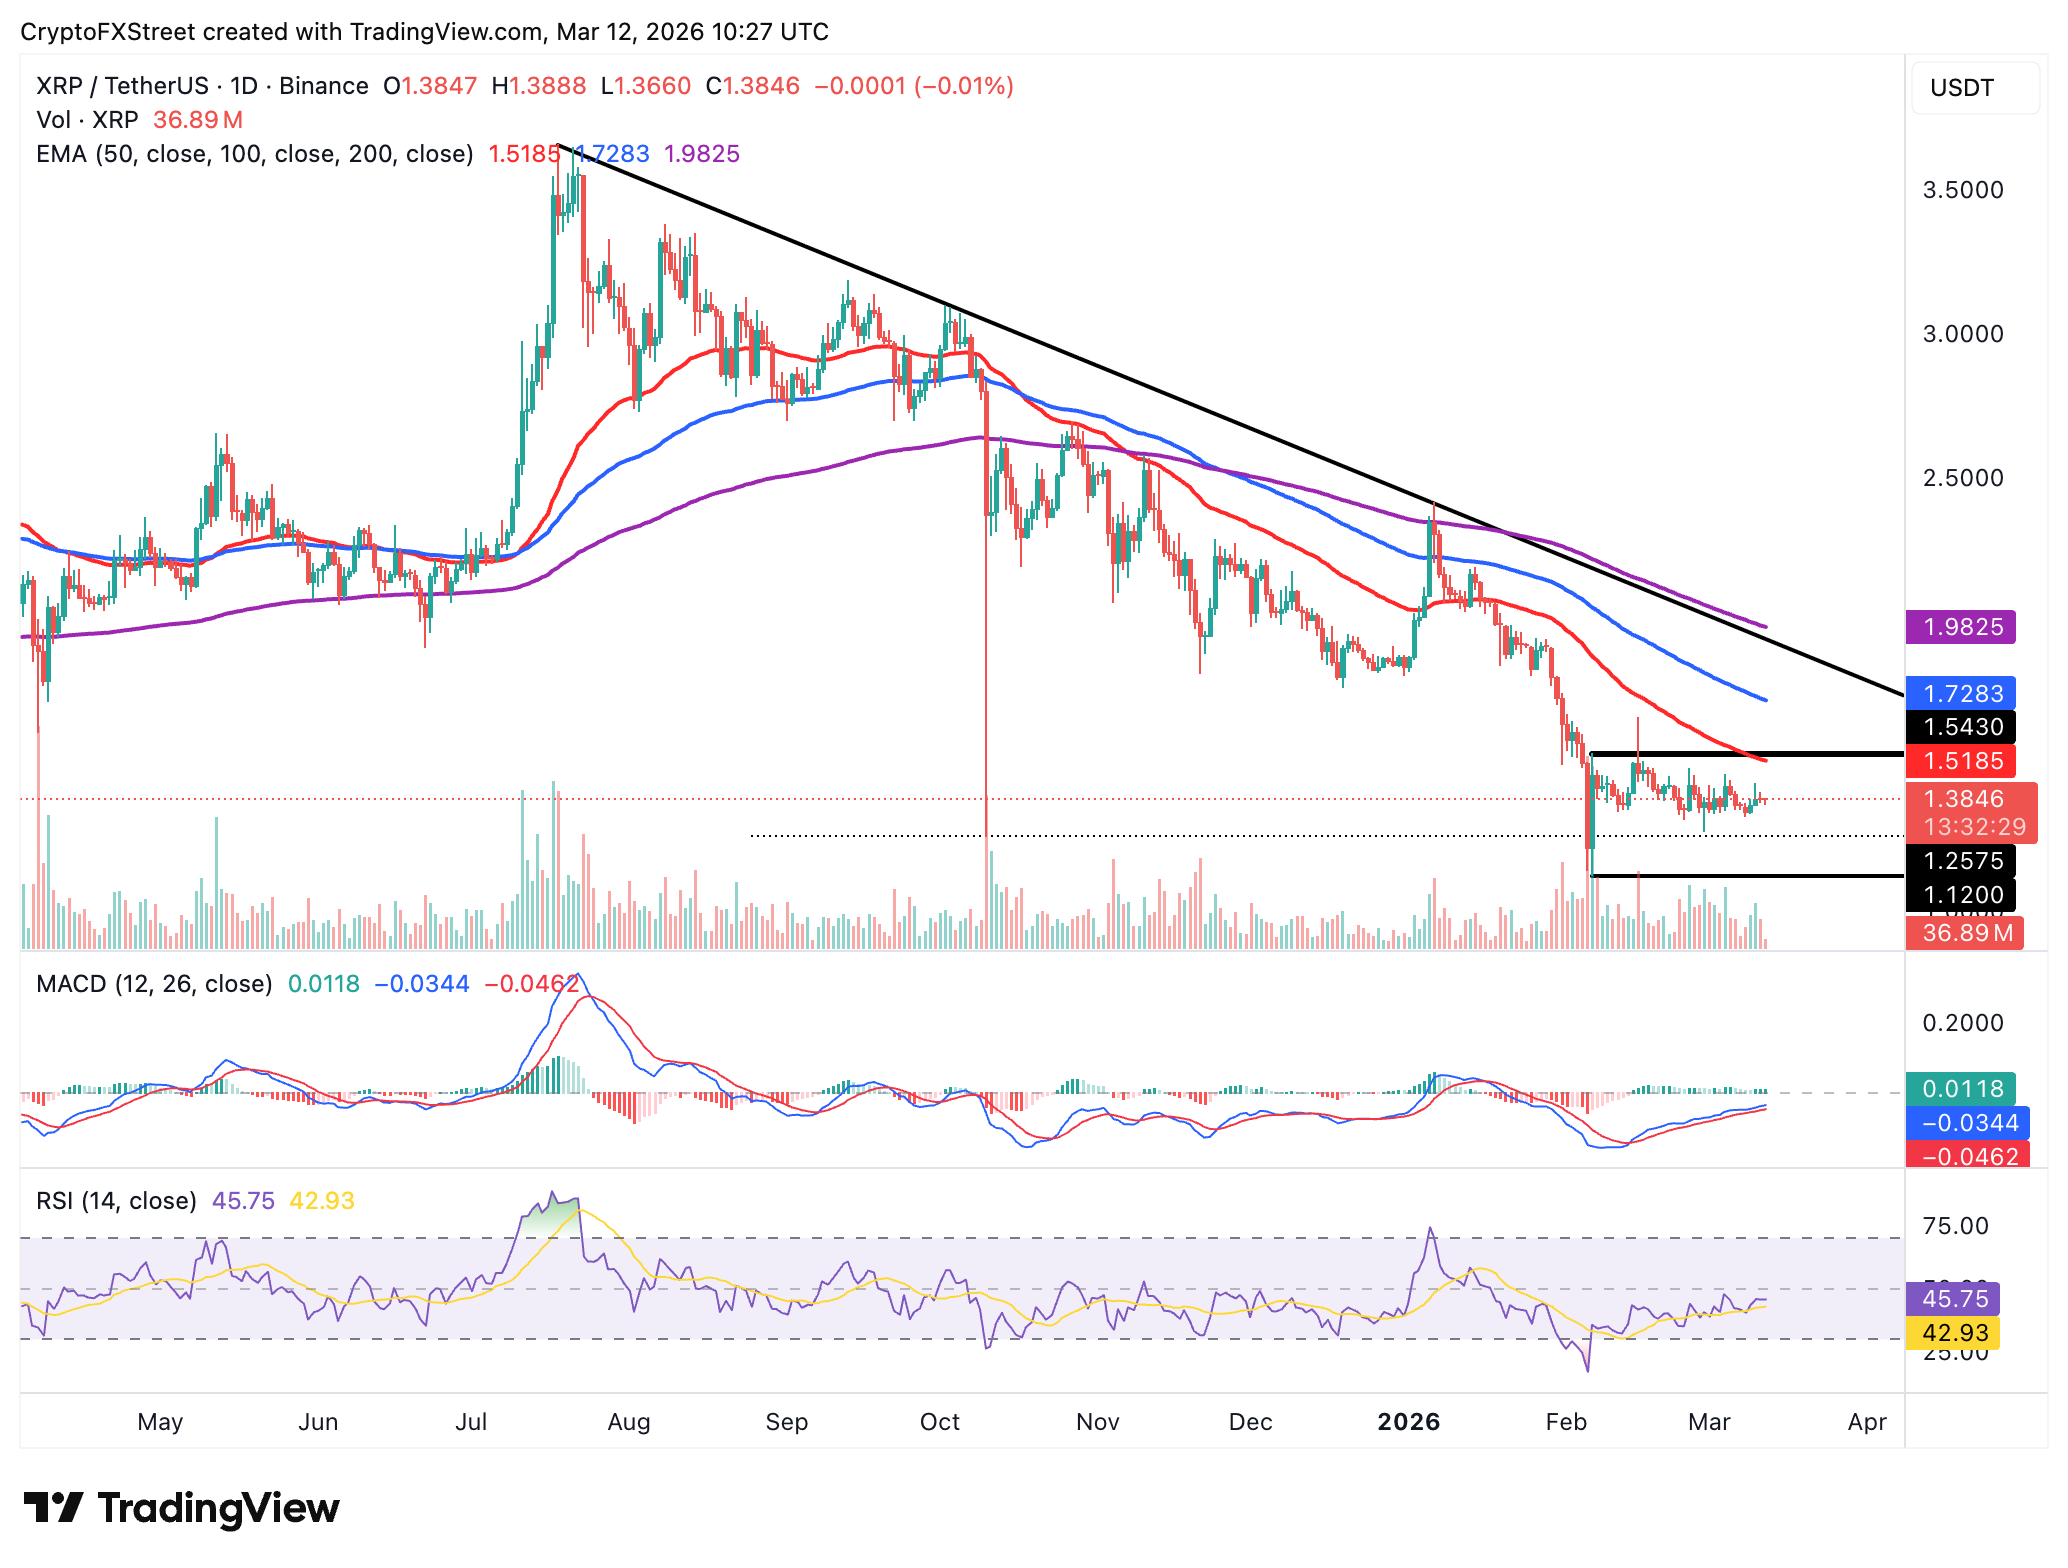
On the upside, the MACD indicator remains above its signal line, which reinforces a strengthening bullish grip. However, the MACD lies below the neutral line on the same chart, which could continue to cap higher advances. Key levels of interest for traders are the weekly open at $1.34 as support and the weekly high at $1.44 as resistance.
Crypto ETF FAQs
An Exchange-Traded Fund (ETF) is an investment vehicle or an index that tracks the price of an underlying asset. ETFs can not only track a single asset, but a group of assets and sectors. For example, a Bitcoin ETF tracks Bitcoin’s price. ETF is a tool used by investors to gain exposure to a certain asset.
Yes. The first Bitcoin futures ETF in the US was approved by the US Securities & Exchange Commission in October 2021. A total of seven Bitcoin futures ETFs have been approved, with more than 20 still waiting for the regulator’s permission. The SEC says that the cryptocurrency industry is new and subject to manipulation, which is why it has been delaying crypto-related futures ETFs for the last few years.
Yes. The SEC approved in January 2024 the listing and trading of several Bitcoin spot Exchange-Traded Funds, opening the door to institutional capital and mainstream investors to trade the main crypto currency. The decision was hailed by the industry as a game changer.
The main advantage of crypto ETFs is the possibility of gaining exposure to a cryptocurrency without ownership, reducing the risk and cost of holding the asset. Other pros are a lower learning curve and higher security for investors since ETFs take charge of securing the underlying asset holdings. As for the main drawbacks, the main one is that as an investor you can’t have direct ownership of the asset, or, as they say in crypto, “not your keys, not your coins.” Other disadvantages are higher costs associated with holding crypto since ETFs charge fees for active management. Finally, even though investing in ETFs reduces the risk of holding an asset, price swings in the underlying cryptocurrency are likely to be reflected in the investment vehicle too.
(The technical analysis of this story was written with the help of an AI tool.)
Author

John Isige
FXStreet
John Isige is a seasoned cryptocurrency journalist and markets analyst committed to delivering high-quality, actionable insights tailored to traders, investors, and crypto enthusiasts. He enjoys deep dives into emerging Web3 tren

