Crypto Today: Bitcoin, Ethereum, XRP consolidate ahead of US CPI inflation data
- Bitcoin trades below $70,000 on Wednesday as volatile Oil prices tied to the US–Iran war fuel inflation concerns.
- Ethereum turns lower after a two-day recovery, risking a move below $2,000.
- Ripple extends consolidation within a tight range, weighed down by bearish moving averages.

Bitcoin (BTC), Ethereum (ETH), and Ripple (XRP) remain under pressure from the escalating US-Iran war, which is driving Oil prices higher and raising concerns about higher inflation. The release of the US Consumer Price Index (CPI) for February on Wednesday could spark volatility in the broader cryptocurrency market, as investor sentiment remains vulnerable.
US CPI data in focus
US consumer prices, as measured by the CPI, are expected to grow 2.4% Year-on-Year (YoY), the same pace as in January. The CPI data for February is likely to remain unaffected by the US-Iran war, which began on February 28. Still, investors are paying close attention to the inflation data as it could influence the US Federal Reserve's (Fed's) decision on interest rate next Wednesday.
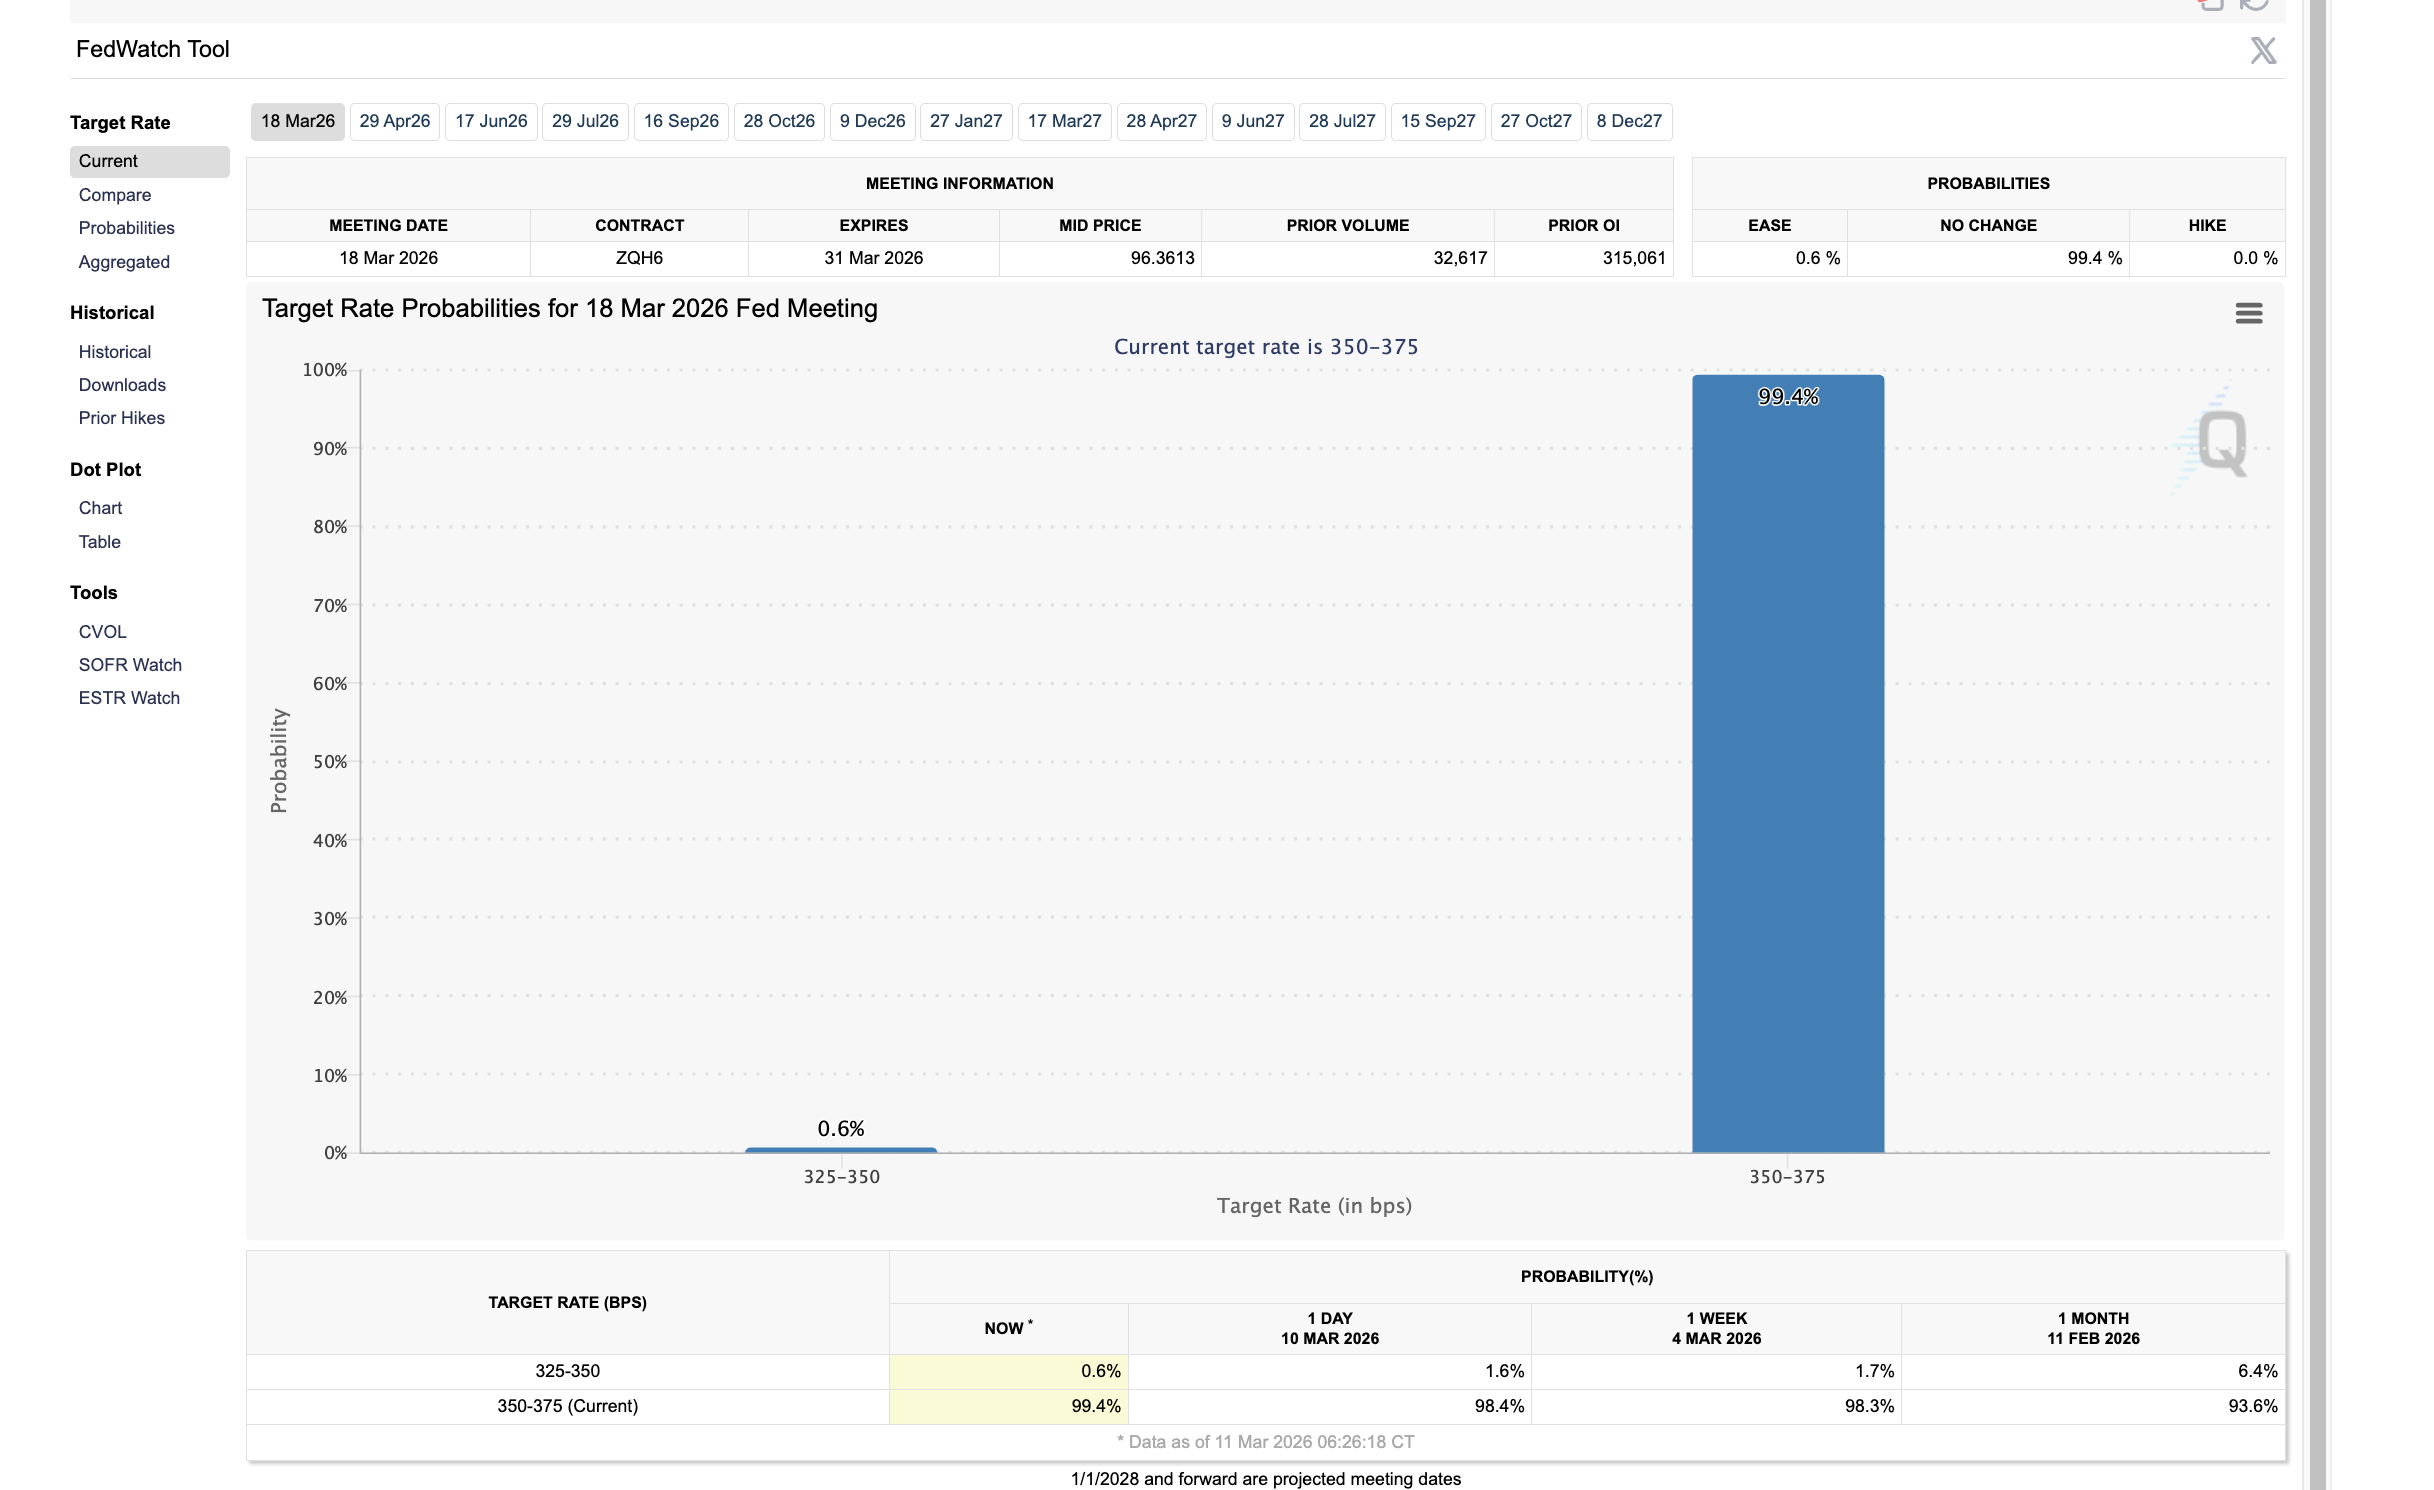
Typically, a lower-than-expected CPI data could increase the likelihood of a rate cut, directing liquidity into high-risk assets such as stocks and Bitcoin. However, the FedWatch tool shows a 99% likelihood that the Fed will keep interest rates unchanged.
Bitcoin slips back under $70,000 again
Bitcoin hovers below $70,000 at press time on Wednesday, facing downside pressure ahead of the US CPI data release. The downward-sloping 50-day, 100-day, and 200-day Exponential Moving Averages (EMAs) in a cluster suggest a prevailing bearish bias and act as overhead resistance to cap recovery.
If Bitcoin clears above $70,000, the 50-day EMA at $73,024 could serve as the immediate resistance.
The Moving Average Convergence Divergence (MACD) line holds above its signal line and remains in positive territory, with a modest positive histogram suggesting underlying upside pressure. The Relative Strength Index (RSI) at 50 underscores a neutral to mildly positive tone.
On the downside, the key support area for BTC lies around $62,000.
Ethereum stalls recovery within a range
Ethereum is trading above $2,000 at the time of writing on Wednesday, trading in the red after a two-day recovery. ETH has been consolidating within the February 5 price range, from $1,818 to $2,173, keeping the near-term bias neutral. However, the descending 50-, 100-, and 200-day EMAs skew the broader trend bearish.
The MACD rises with its signal line, with a modest positive histogram that suggests improving but not aggressive bullish momentum. The RSI near 48 sits close to the midline, aligning with a consolidative backdrop.
Looking up, a resistance cluster emerges with the $2,173 level and the 50-day EMA at $2,224. A decisive close above this level could target the 100-day EMA at $2,555.
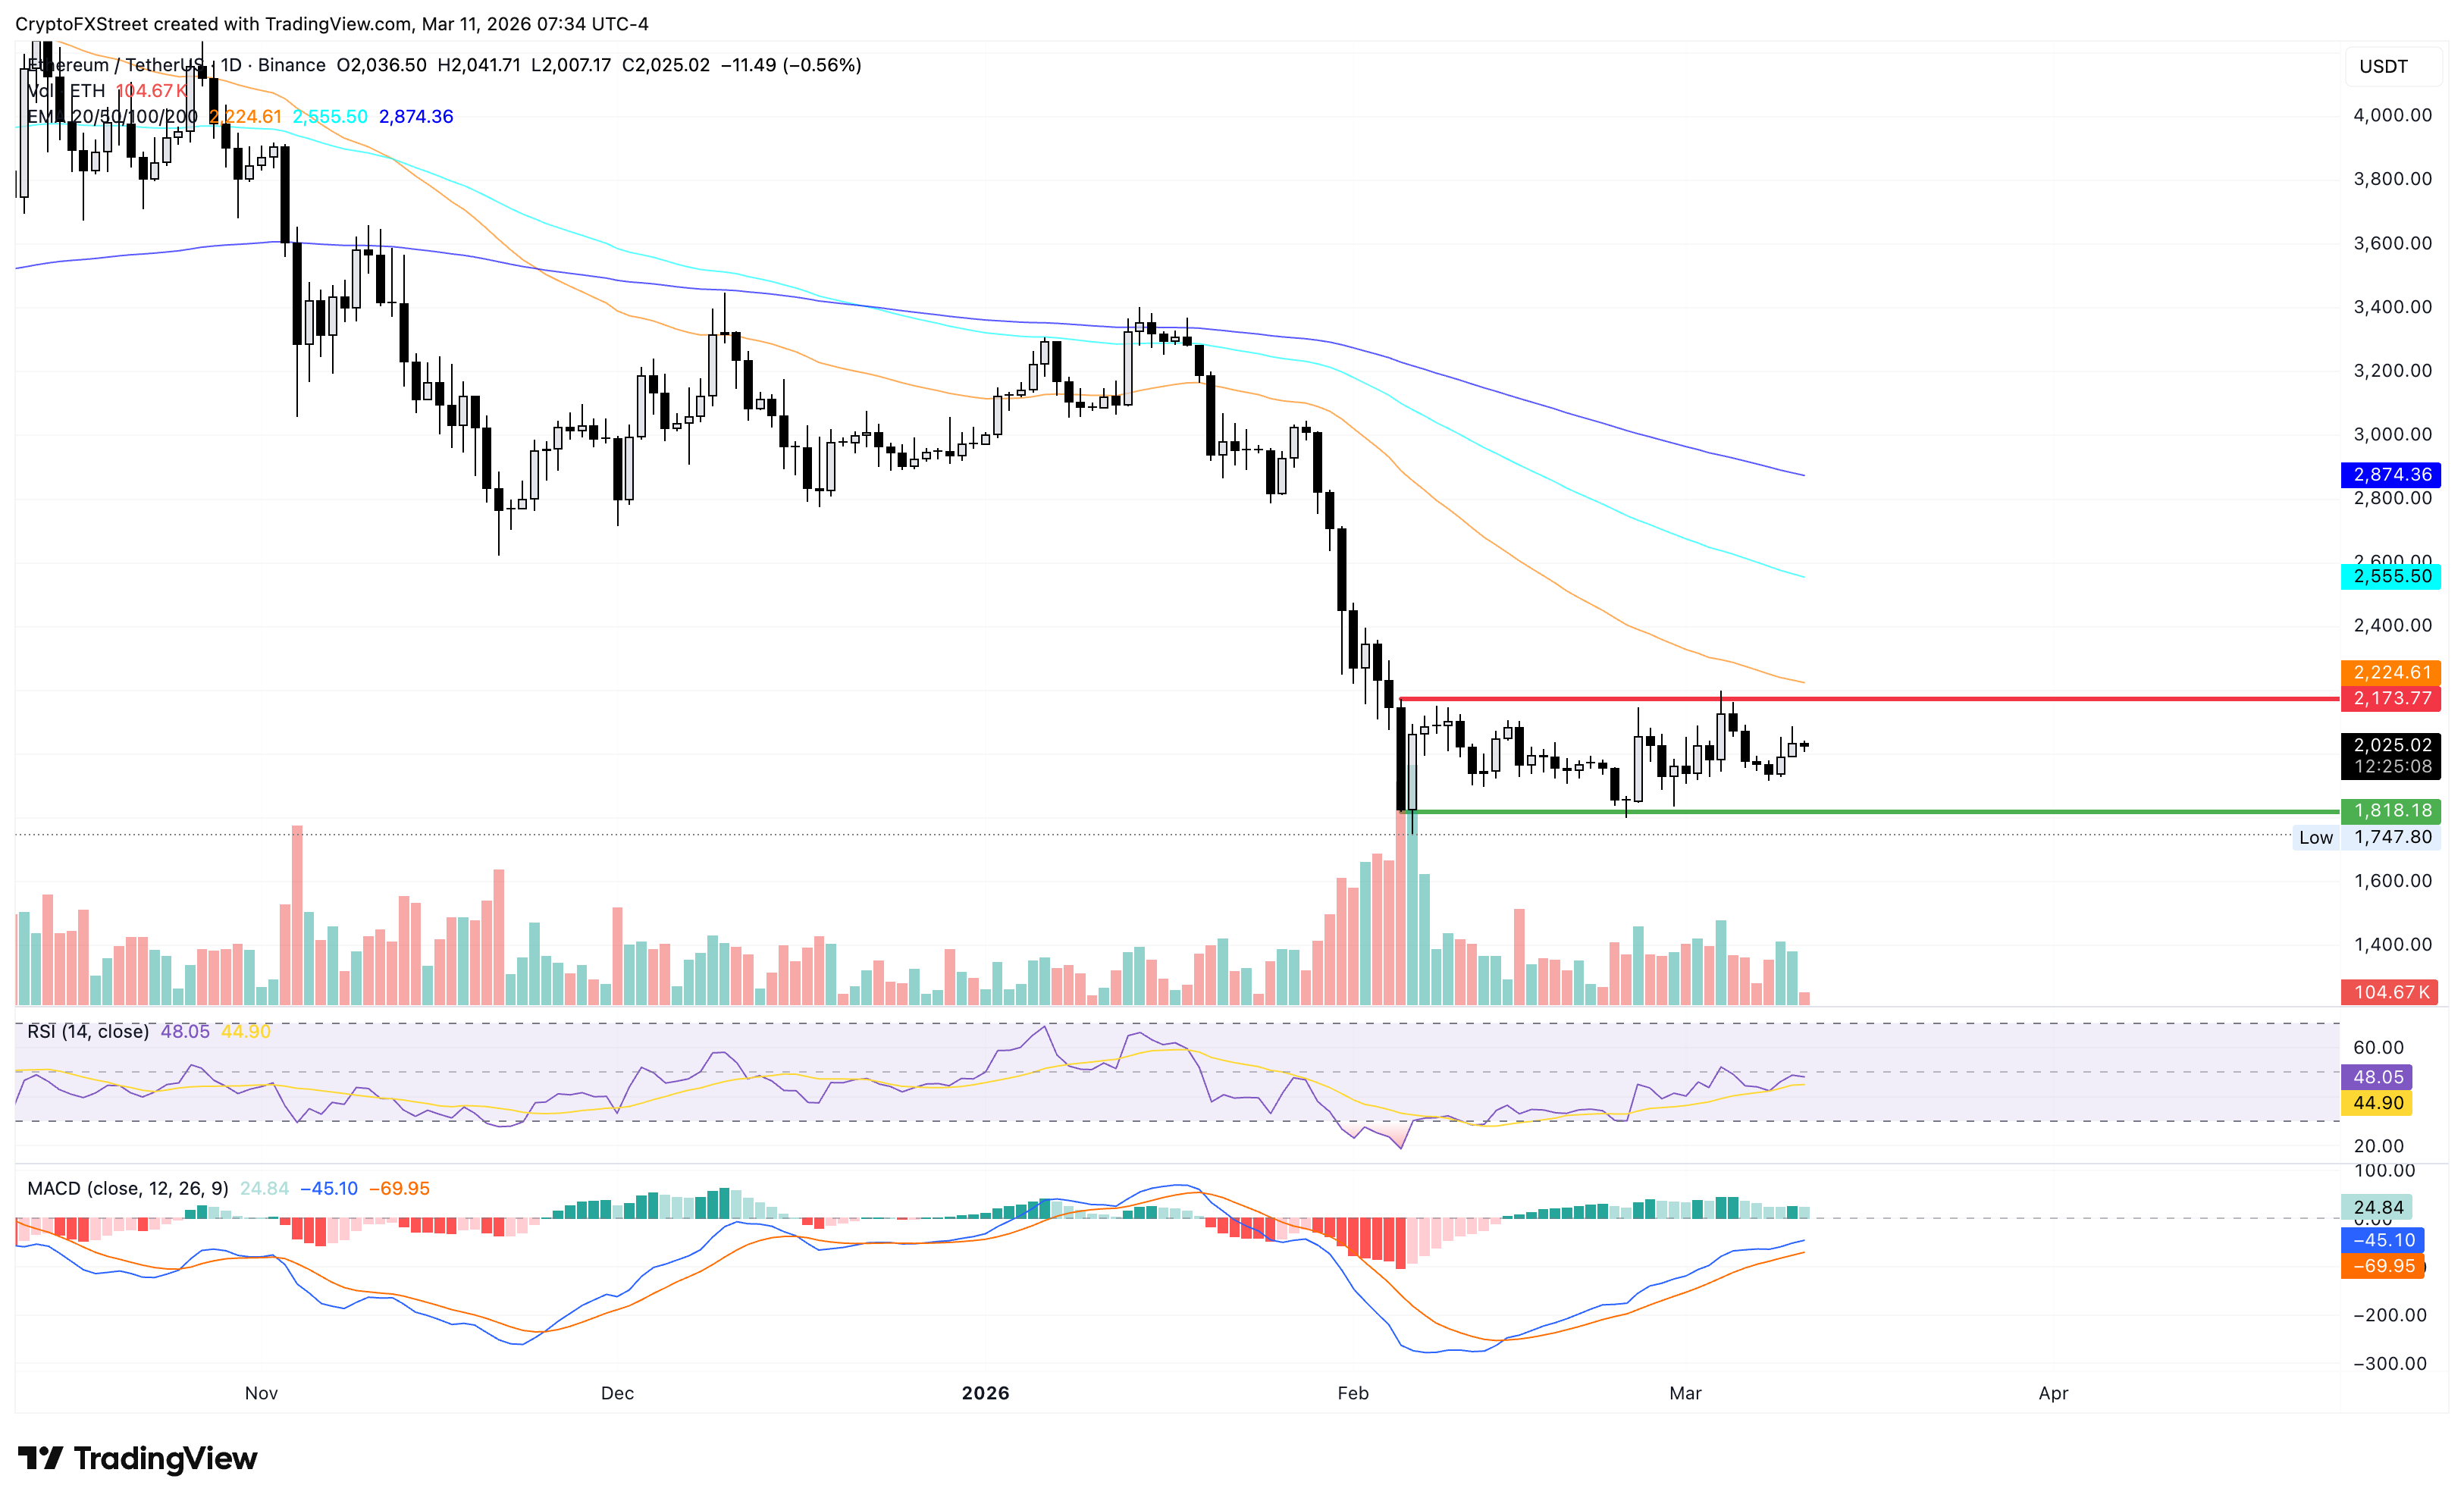
On the flip side, the $1,818 level continues to serve as the immediate support level.
Ripple risks a bearish outcome to its consolidation
Ripple trades below $1.40 at press time on Wednesday, approaching the $1.3328 base of a consolidation range, with the upper ceiling at $1.5154. If XRP slips below $1.3328, it could threaten the February 6 low at $1.1172.
The near-term bias is cautiously neutral with a downside tilt. The MACD is marginally above its signal line, while the RSI at 44 recovers from earlier lows, suggesting mild relief in bearish momentum but not a confirmed trend reversal.
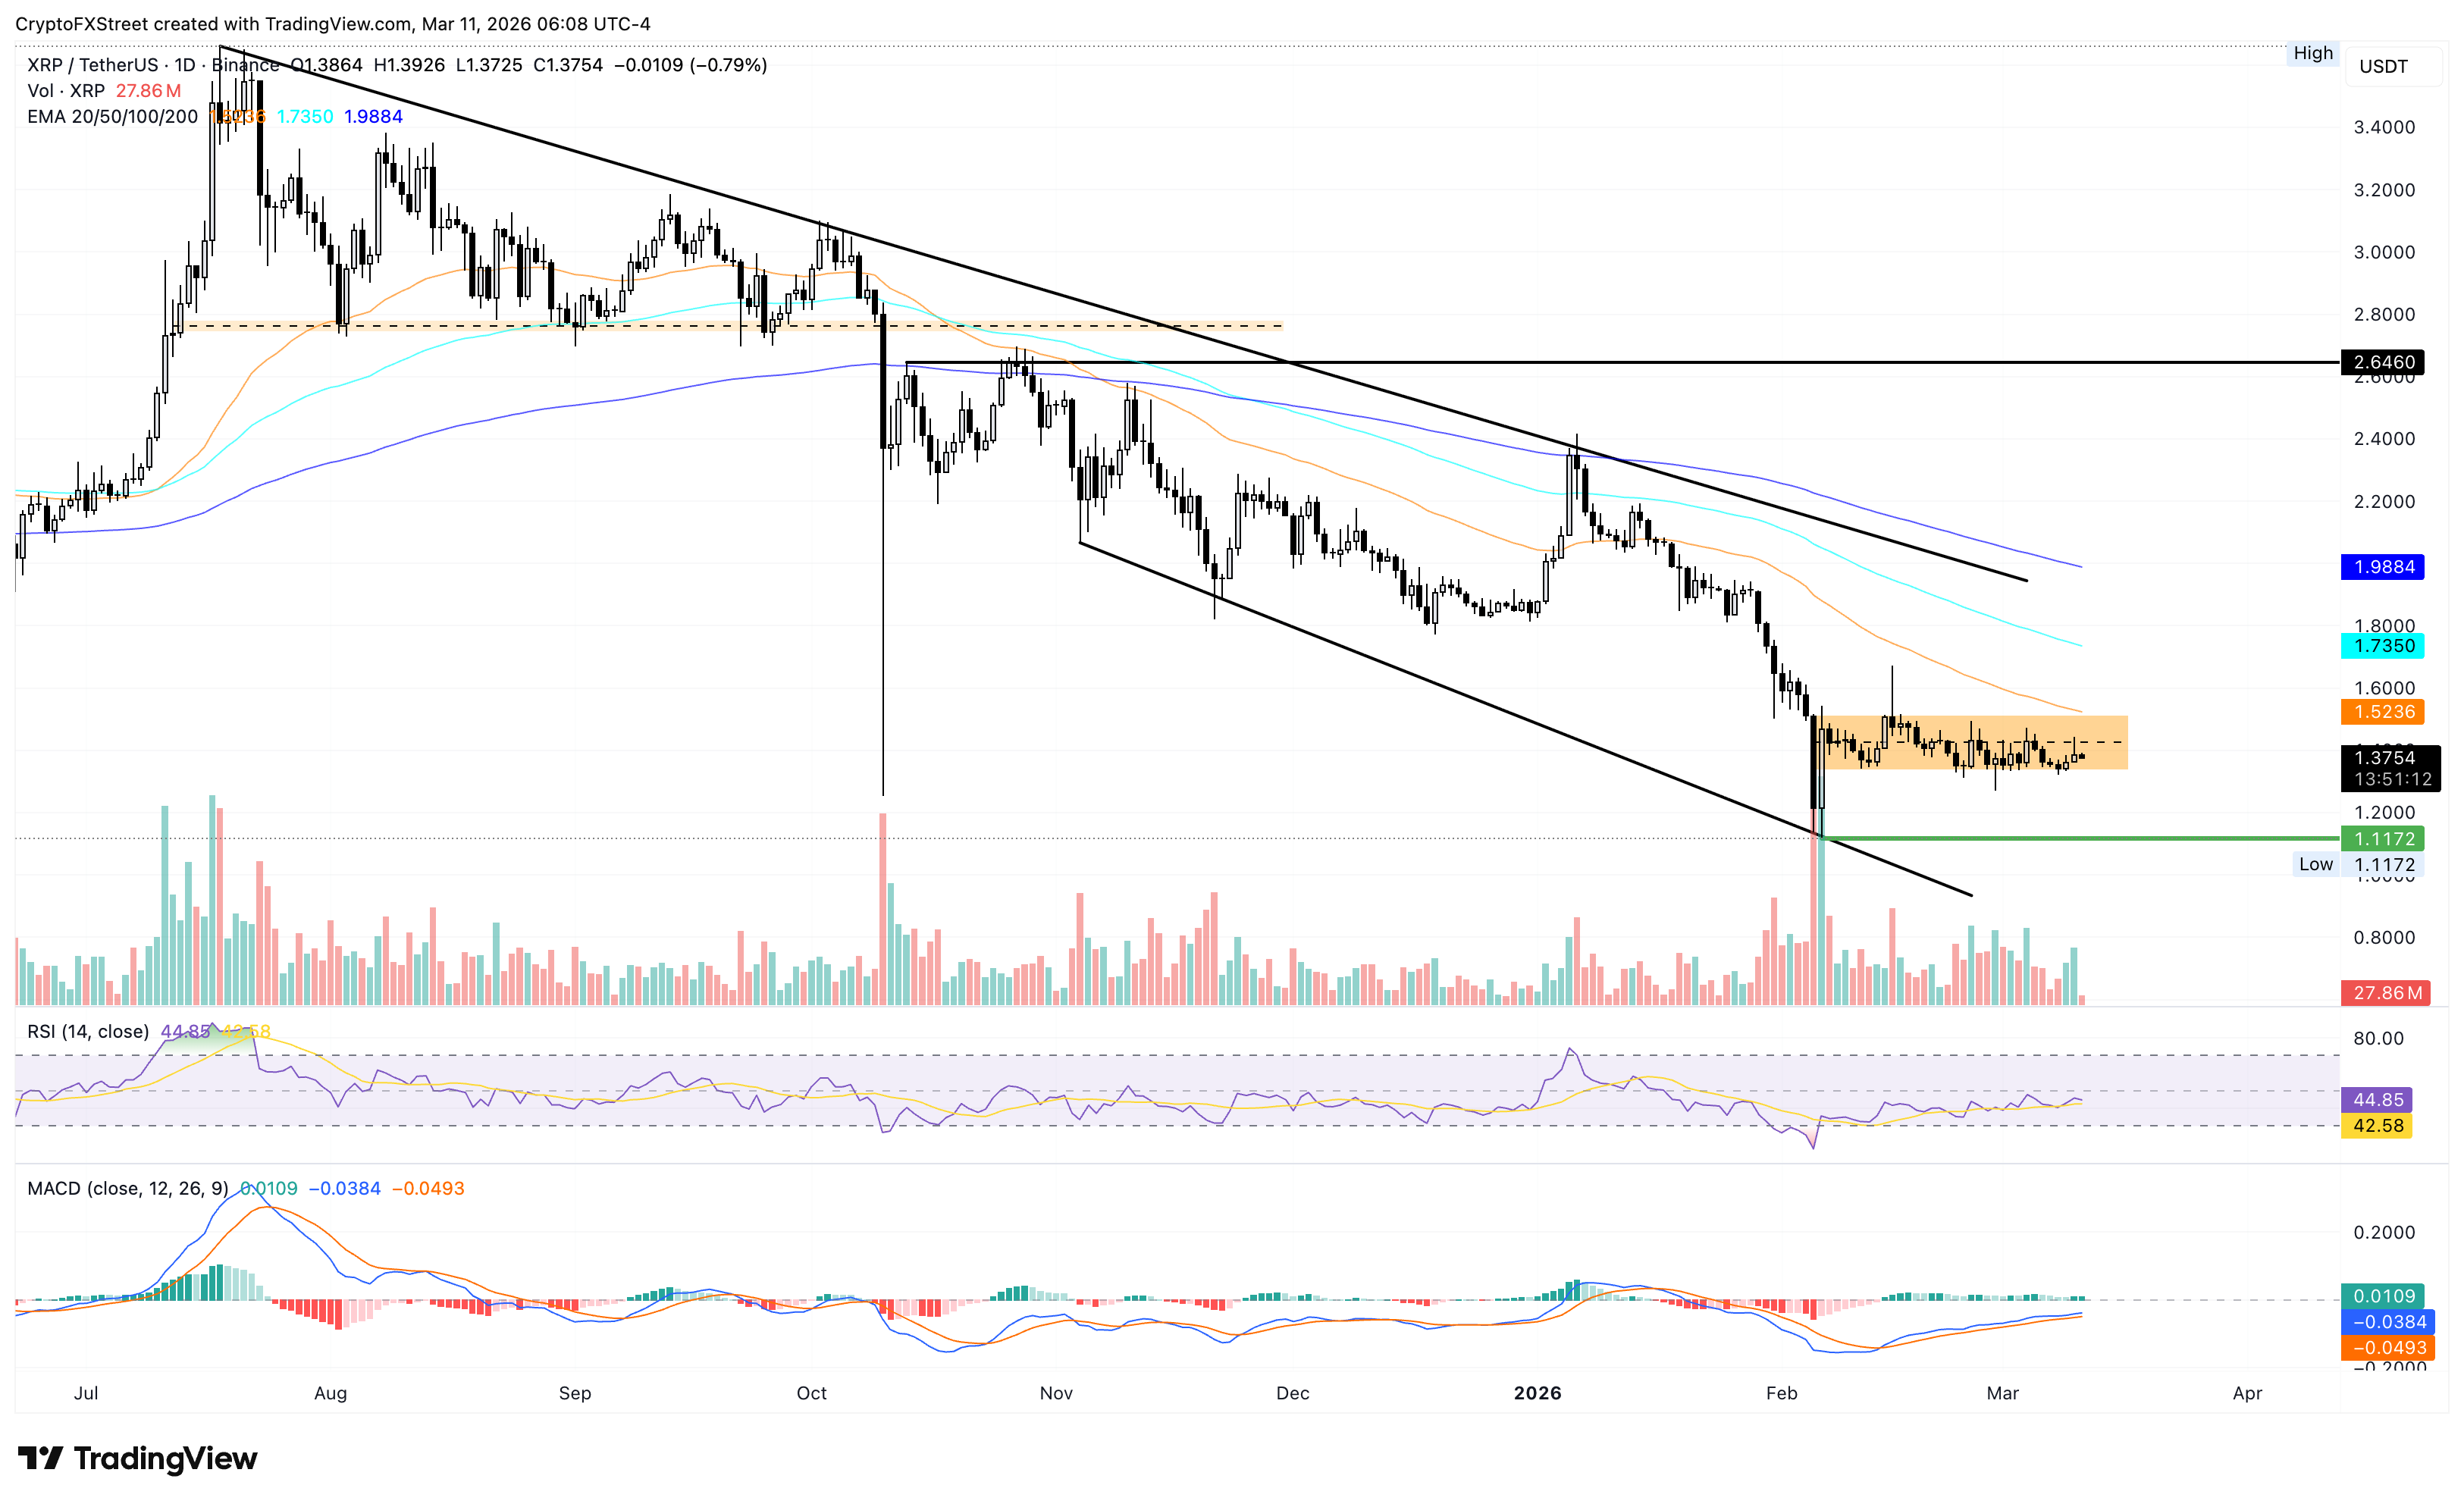
On the upside, XRP could face headwinds near the $1.5154 ceiling, near the 50-day EMA at $1.5236.
(The technical analysis of this story was written with the help of an AI tool.)
Author

Vishal Dixit
FXStreet
Vishal Dixit holds a B.Sc. in Chemistry from Wilson College but found his true calling in the world of crypto.



