Crypto Overview: Market whipsaws amid US-Iran ceasefire confusion – WLFI, SUI, PENGU lead losses
- Bitcoin and Ethereum are back under $71,000 and $2,200, respectively, on Thursday.
- Tehran accuses ceasefire violations as Israel strikes Lebanon, while JD Vance heads to Pakistan for direct talks.
- World Liberty Financial, Sui, and Pudgy Penguins led the decline over the last 24 hours.

The broader cryptocurrency market whipsaws as Iran accuses Israel of ceasefire violations, sliding Bitcoin (BTC) and Ethereum (ETH) below $71,000 and $2,200, respectively, at press time on Thursday. Meanwhile, World Liberty Financial (WLFI), Sui (SUI), and Pudgy Penguins (PENGU) led losses over the last 24 hours.
Investor sentiment steadies amid skepticism over US-Iran ceasefire
The White House announced that the JD Vance-led American delegation is headed to Islamabad, Pakistan, for direct talks with Iran amid resurfacing tensions in the Middle East. Iran is accusing Israel of violating the ceasefire. Israel launched strikes on Lebanon, threatening an extended closure of the Strait of Hormuz.
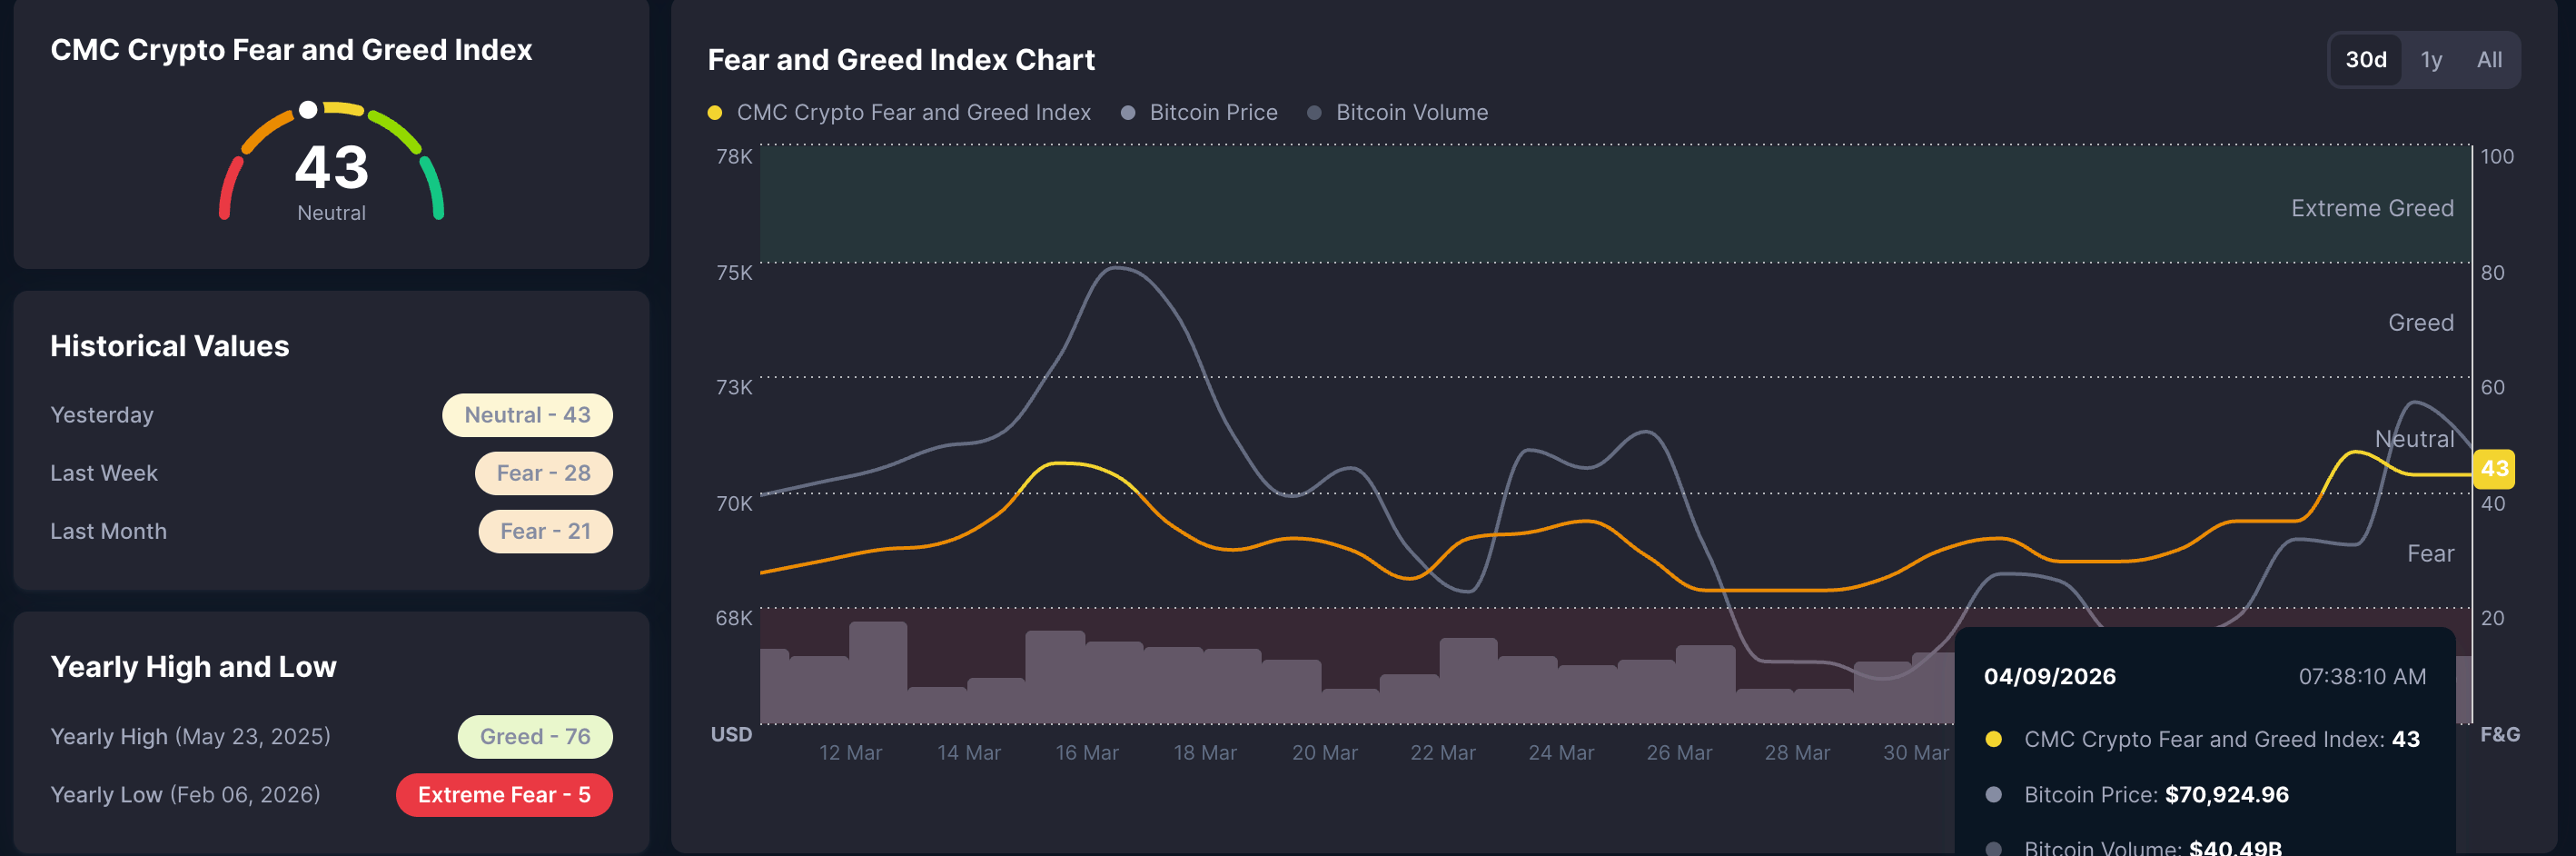
The broader crypto market holds steady amid geopolitical pressure, with CoinMarketCap’s Fear and Greed Index at 43 on Thursday, indicating a neutral stance.
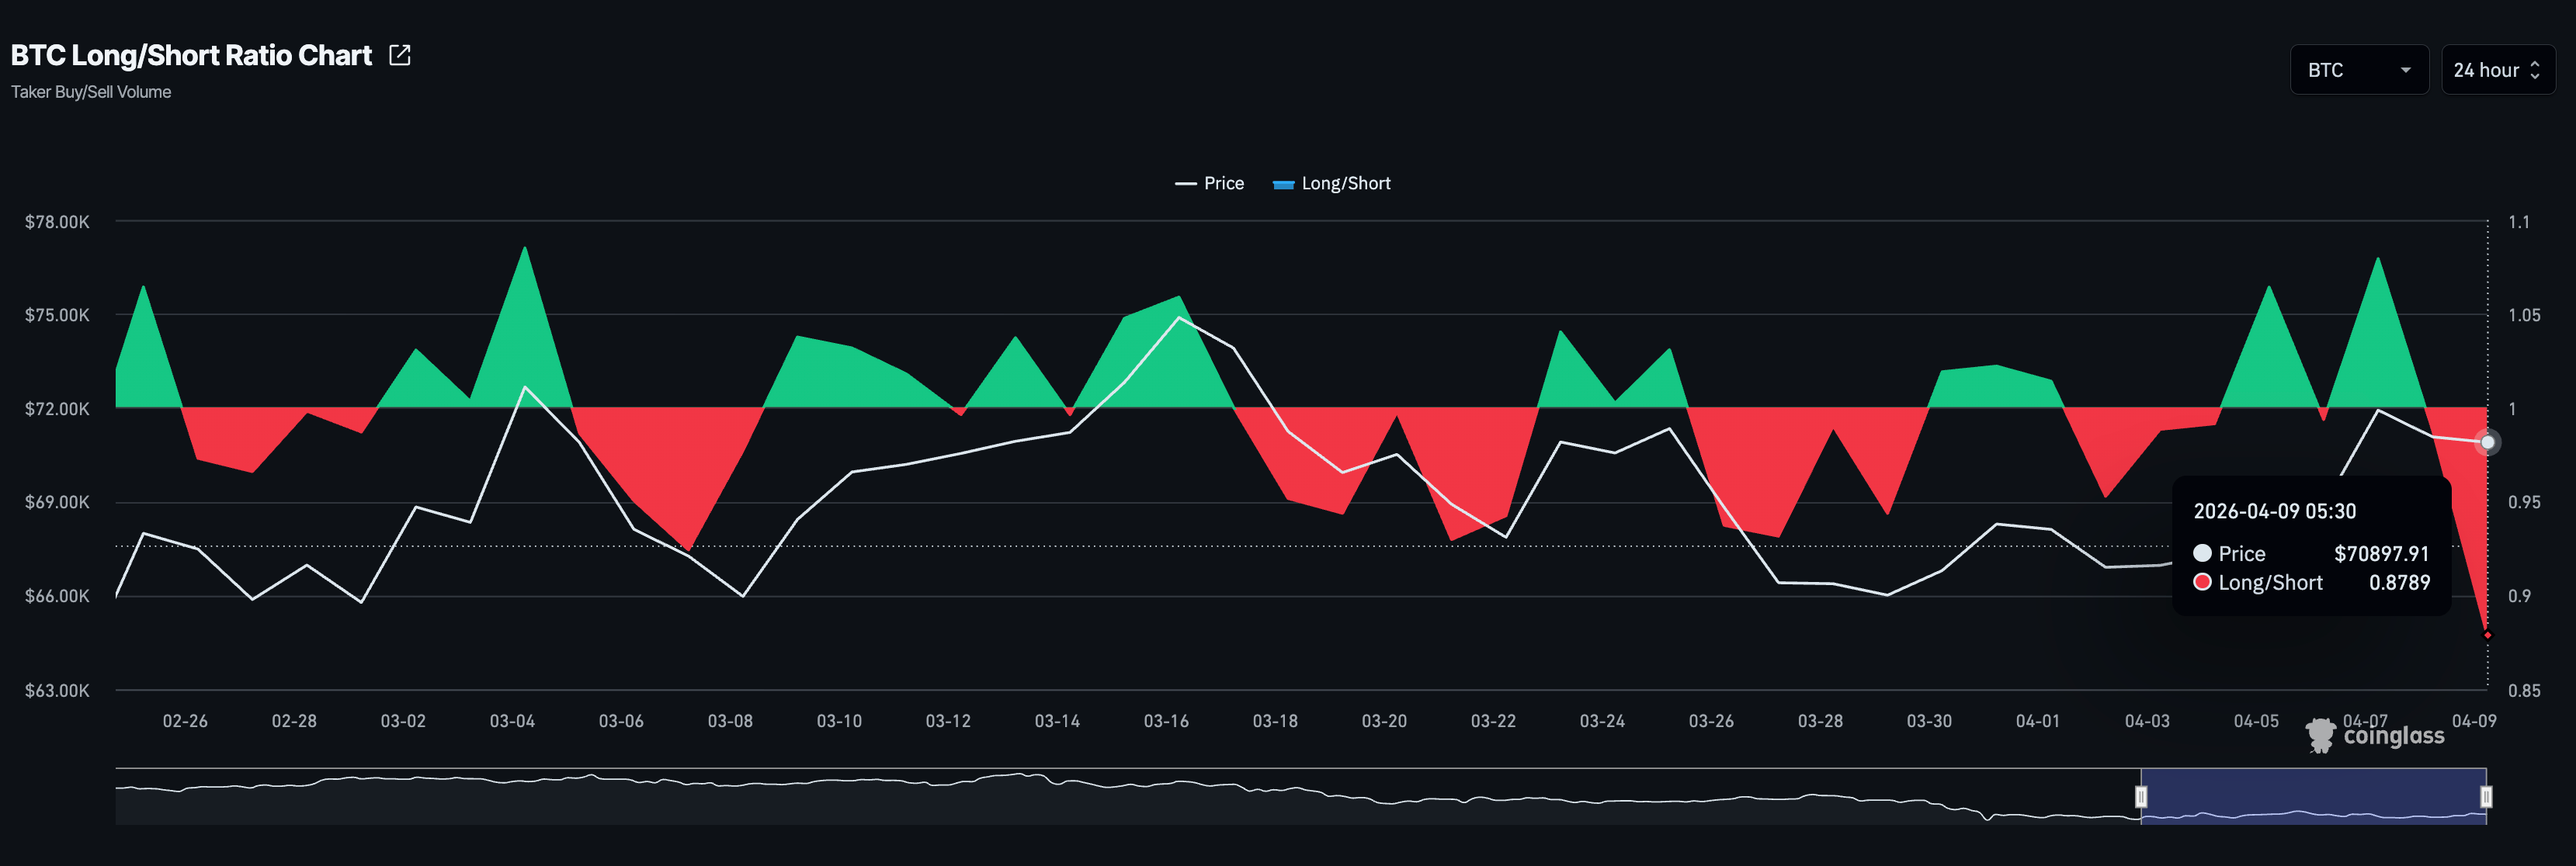
However, the CoinGlass data shows a bearish tilt in the derivatives market, with the Bitcoin long-to-short ratio dropping to 0.8789, suggesting more active short positions as traders bet on the downside.
Technical outlook: WLFI, SUI, and PENGU under pressure
World Liberty Financial trades below $0.1000 at press time on Thursday, extending a bearish phase with price holding well beneath the 50-day Exponential Moving Average (EMA) at $0.1048 and the broader downward resistance trendline originating near $0.1294.
The Relative Strength Index (RSI) around 37 keeps downside pressure in play without yet signaling oversold conditions, while the Moving Average Convergence Divergence (MACD) indicator has slipped back into negative territory, hinting that sellers still retain control after the recent failed attempt to sustain a break above the $0.0999 trendline break area.
On the topside, initial resistance is now aligned with the overhead trendline near $0.1000, which serves as the first barrier to any corrective bounce. A sustained move above that threshold would then face the 50-day EMA at $0.1048 as the next technical cap.
Looking down, the immediate support for WLFI lies at the S1 Pivot Point at $0.0862, close to the descending support trendline.
Sui hovers around $0.90 at the time of writing on Thursday, keeping a bearish near-term tone as it holds well below both the 50-day EMA at $0.9678 and the distant 200-day EMA at $1.5983. The price continues to track within a consolidation zone between $0.84 and $1.08.
Momentum is mixed, with the RSI hovering just below the midline and the MACD marginally positive, suggesting recent downside pressure is moderating rather than reversing the broader bearish structure.
Looking up, immediate resistance lies at the 50-day EMA at $0.96, and a sustained break above this barrier would likely challenge the $1.08 ceiling.
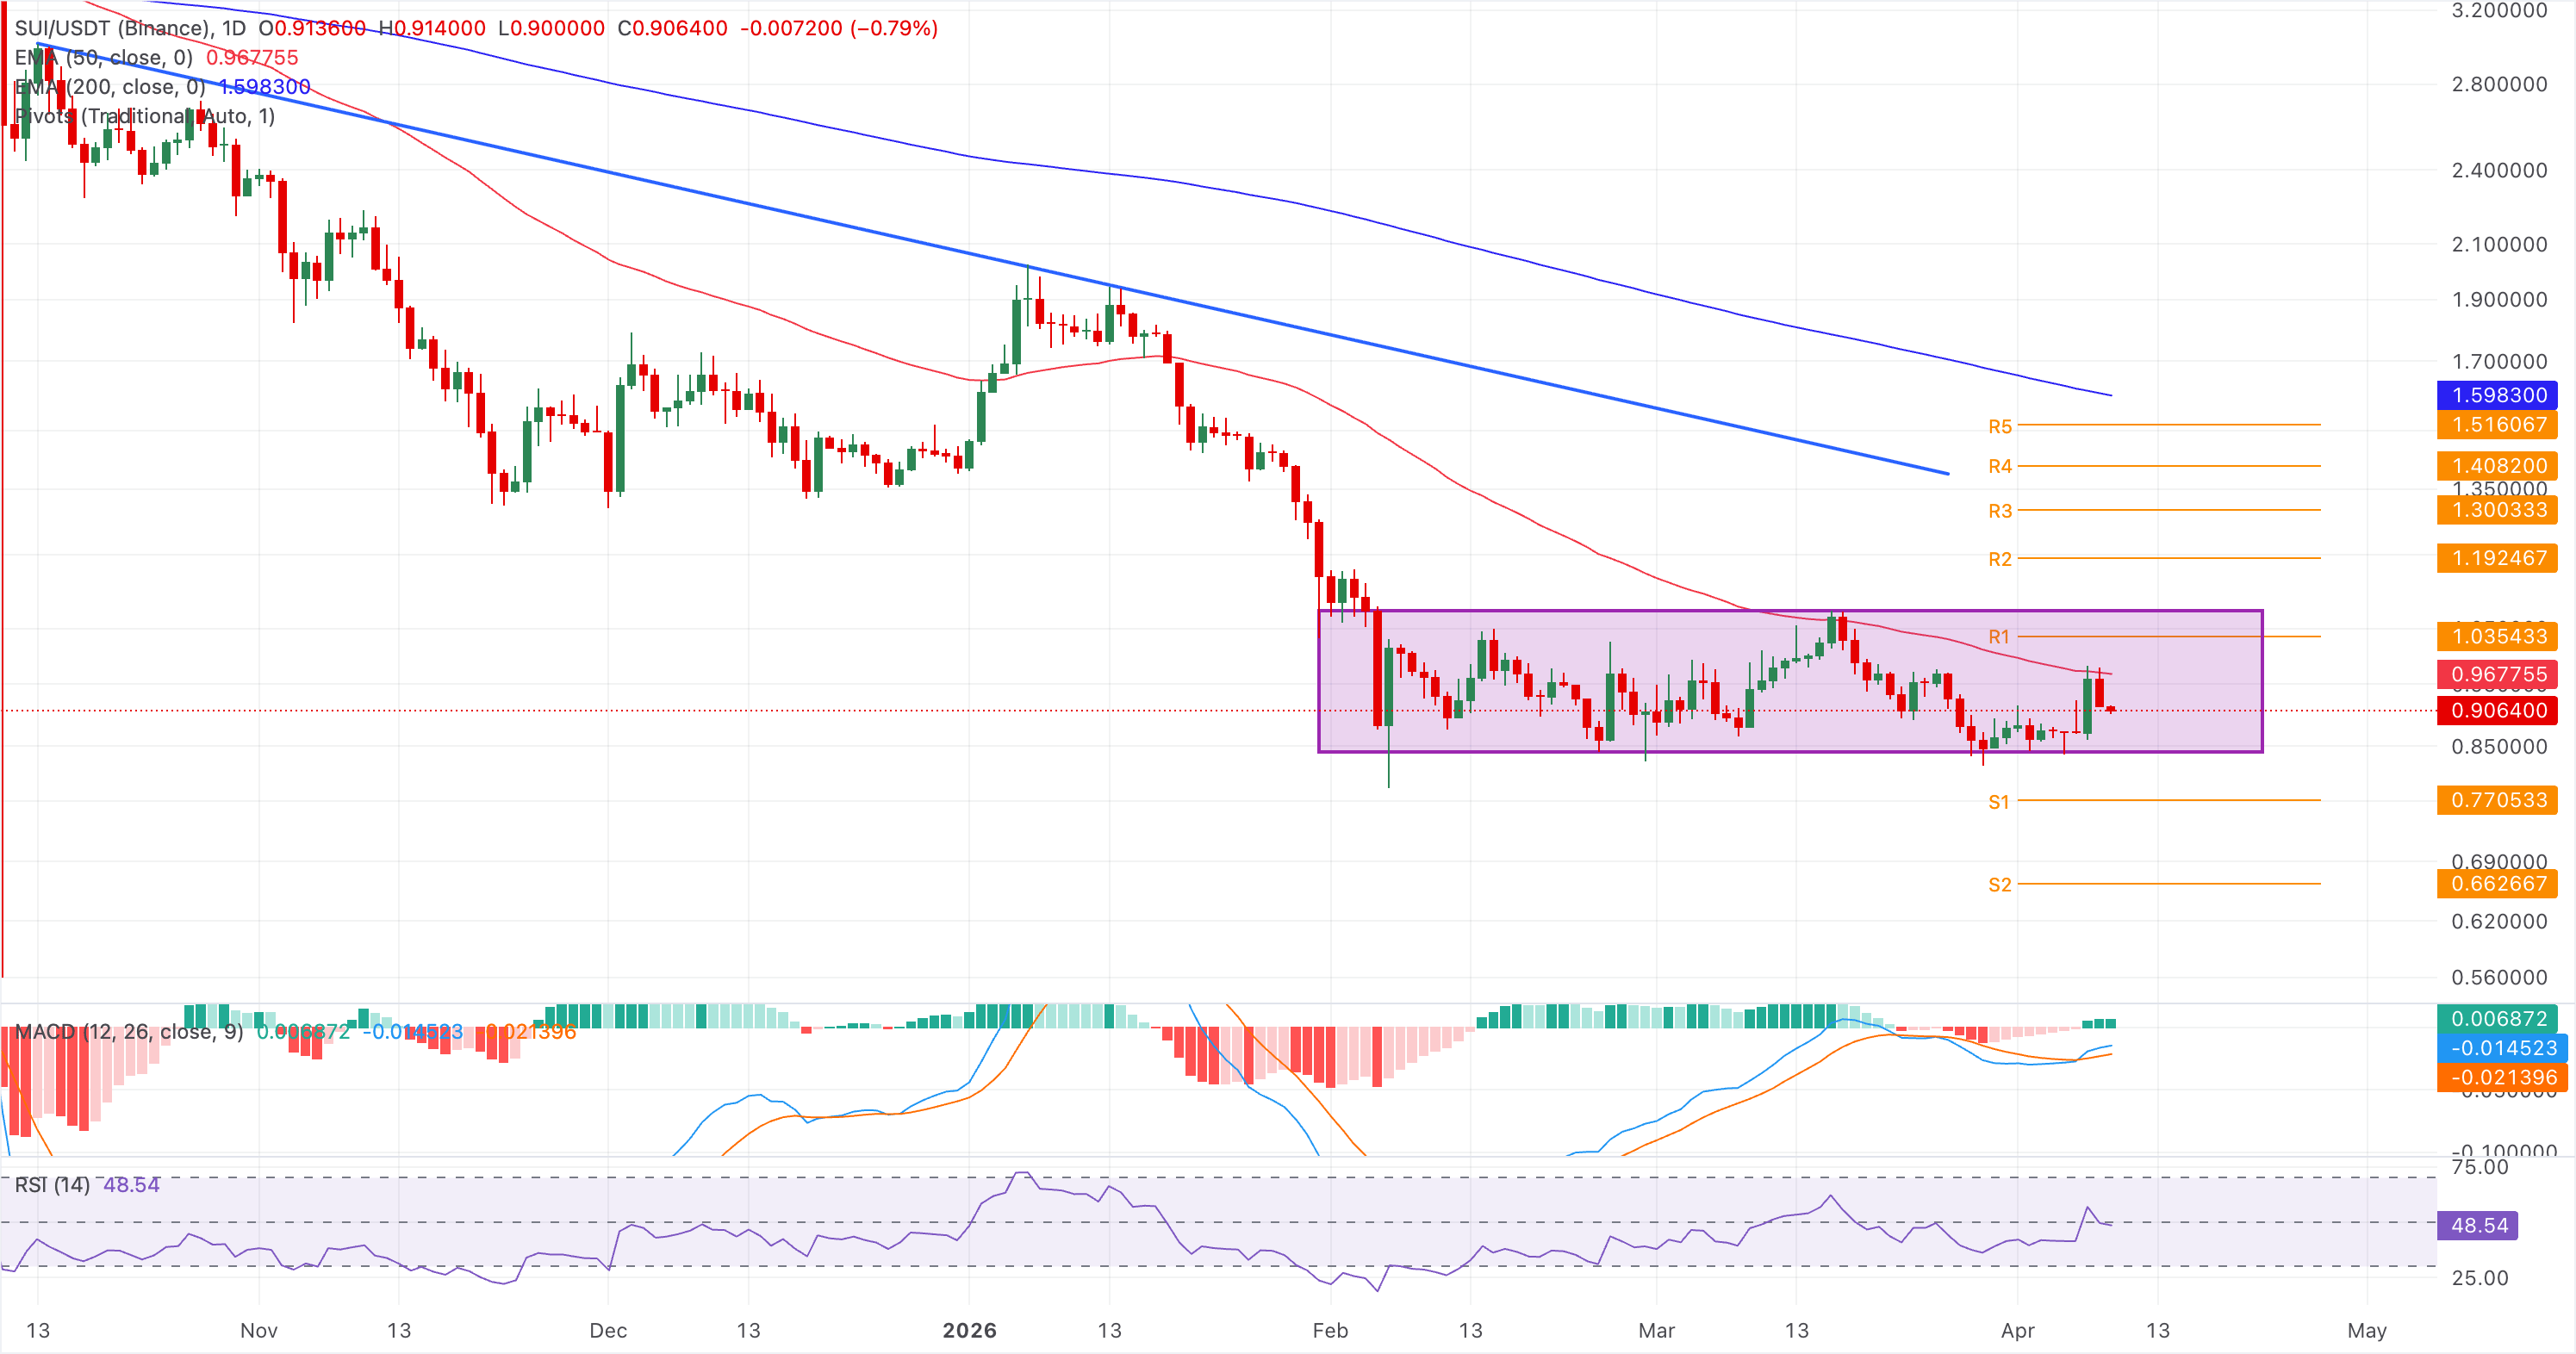
On the downside, the consolidation floor at $0.84, followed by the S1 Pivot Point at $0.77, serves as a crucial support level.
Pudgy Penguins is down 2% at press time on Thursday, extending the nearly 5% loss from the previous day. PENGU keeps a bearish near-term tone as it holds below both the 50-day EMA at $0.0070 and the 200-day EMA at $0.0116.
The pair also remains under a long-running downward resistance trendline that was last interacted with near $0.0078, while the RSI is around 44, and a flat MACD profile hints at subdued momentum rather than an imminent bullish reversal.
Immediate support for PENGU lies at the February 5 low at $0.005919, followed by the S1 Pivot Point at $0.005601.
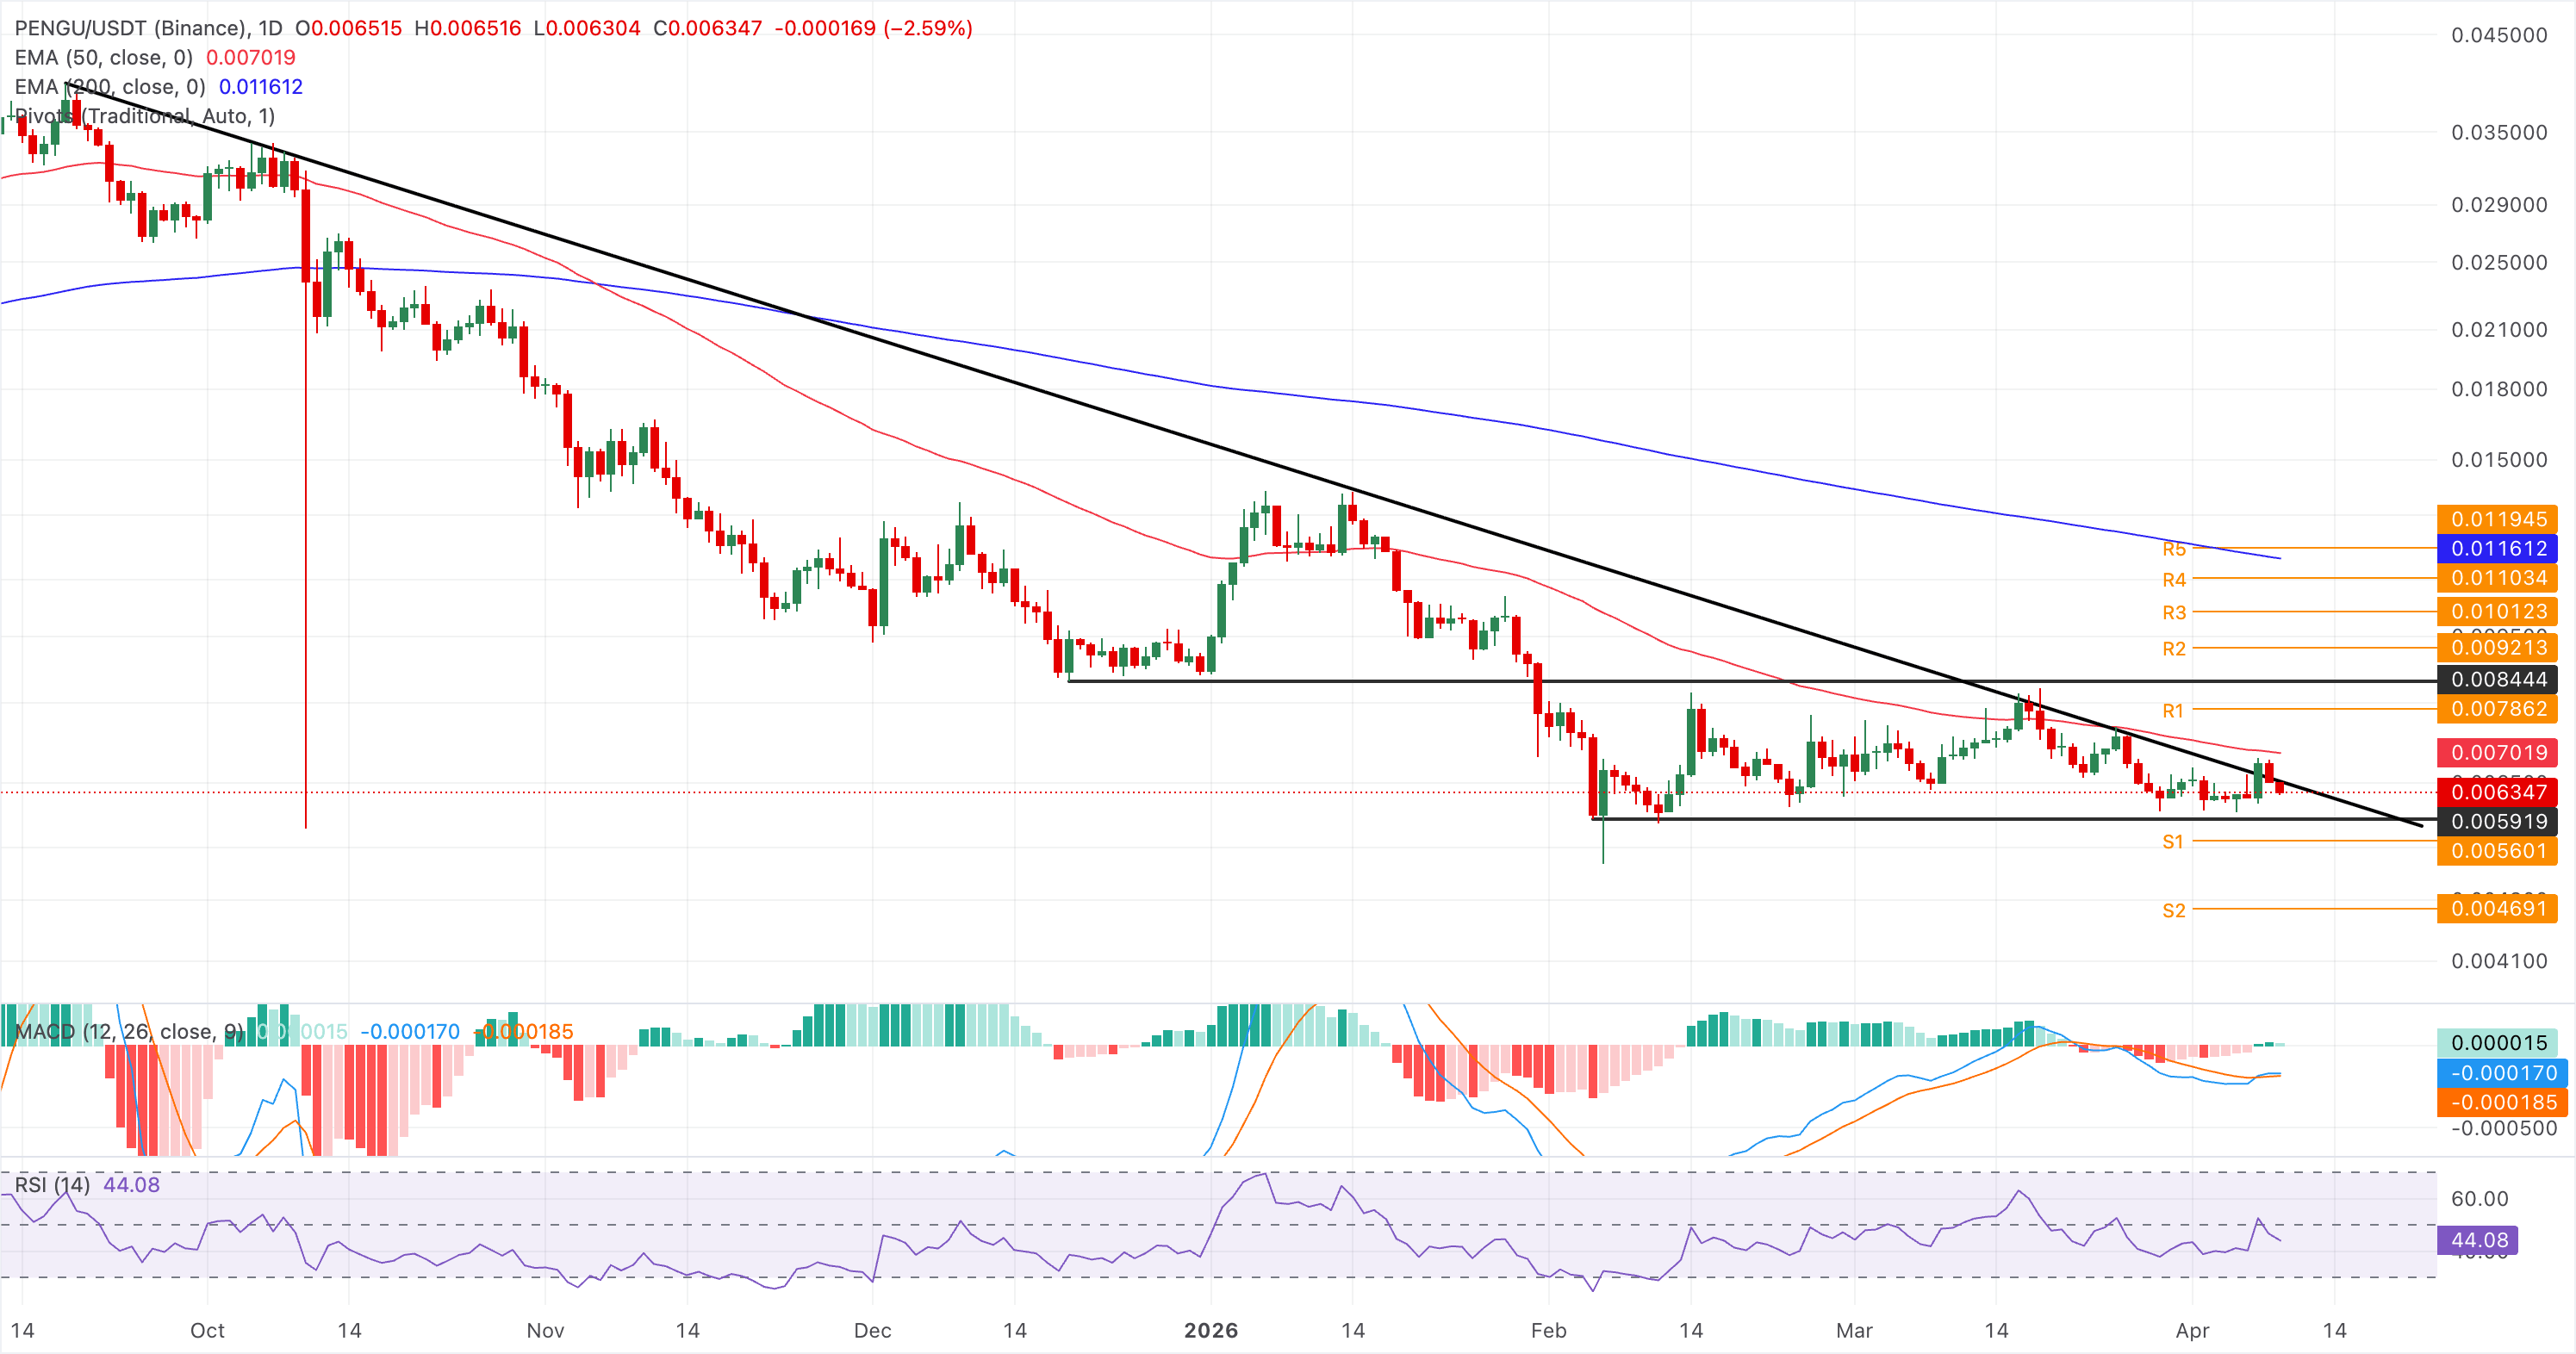
The initial resistance is located at the 50-day EMA at $0.007019, which guards the upside toward the R1 Pivot Point at $0.007862.
(The technical analysis of this story was written with the help of an AI tool.)
Author

Vishal Dixit
FXStreet
Vishal Dixit holds a B.Sc. in Chemistry from Wilson College but found his true calling in the world of crypto.



