Caution for Bitcoin holders: $80K resistance and a bear flag pattern

After breaking ~$75,000, Bitcoin has made significant progress towards $80,635.
But that still does not invalidate the fact that the bedrock of crypto has been in a downtrend since November last year.
Several technical factors now line up to present an imminent decline on Bitcoin:
Note, this is not a trade setup, but rather a technical bias we’re presenting here; simply by way of multiple bearish confluences lining up. Personally, I expect Bitcoin to, sooner rather than later, begin its final leg lower before a true bottom is formed.
Daily chart analysis (Bitcoin, May 4th, 2026)
Every retest of the 200 EMA band (0.25 sd) has resulted in a rejection since the Death Cross back in November.
And with volume steadily decreasing, that adds to the idea that a potentially strong bearish swing is just around the corner.
Additionally, there’s an argument to be made that Bitcoin is currently forming its 4th leg within a Elliott Wave 5-wave pattern, as the 4th leg typically takes the longest to form / consolidate. And that aligns with what we’re seeing on the charts, for now.
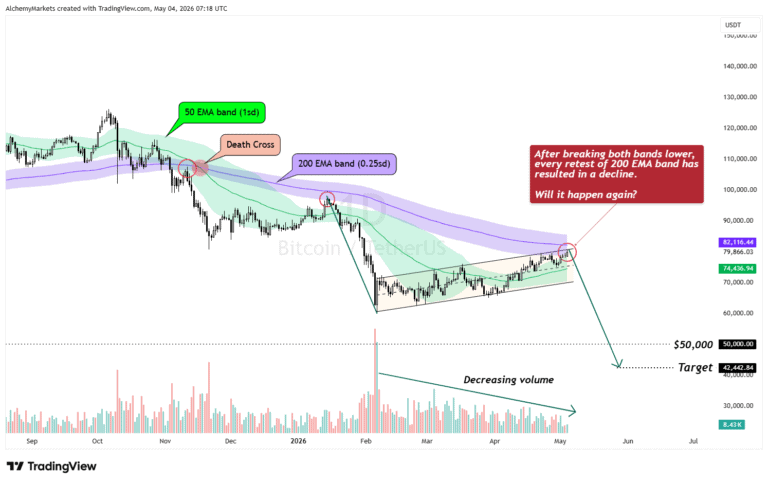
For full confirmation, the rising channel’s low at around $70,000 would have to be broken; but aggressive traders may use this 200 EMA band (0.25 sd) as a reference to consider swing-short setup.
Weekly chart analysis (Bitcoin, May 4th, 2026)
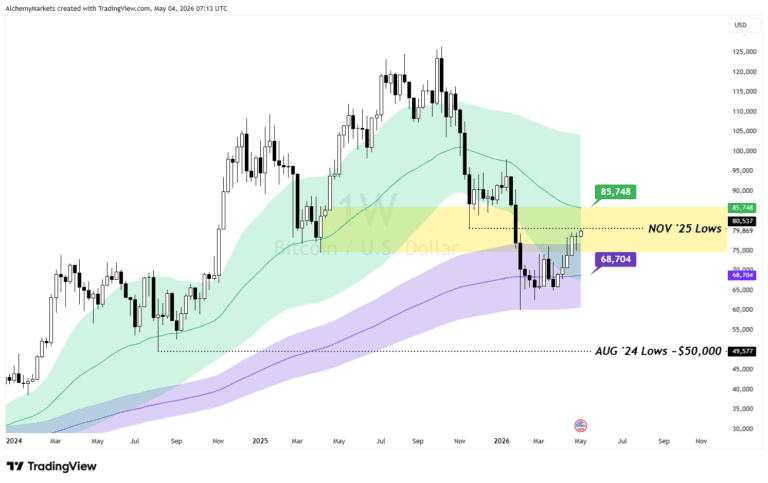
On the weekly chart, Bitcoin is clearly running into a resistance zone marked by its weekly low from ~$75K to ~85.7K.
Coincidentally, the midline and edges of this zone aligns almost perfectly with:
These confluences align with our bearish view on the daily timeframe.
On-chain analytics suggest a Bitcoin low isn’t in (Yet)
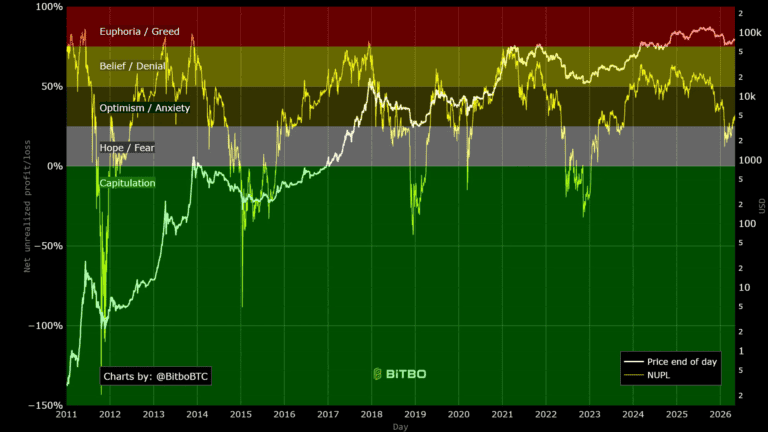
Even by on-chain analytics, Bitcoin’s NUPL (Net Unrealised Profit-Loss) chart is indicating that a bottom isn’t in. According to this chart, Bitcoin must reach its capitulation zone, where most Bitcoin holders are in losses rather than in profit, before a bottom is found.
If you are considering a short position on Bitcoin, note that this analysis is based on higher timeframes.
Therefore, it’s specific, but not precise. That means even though Bitcoin has already tested a key resistance at $80,537, there is still a chance it can push higher into $85K. Especially if this Tuesday’s AI earnings from AMD, Navitas, and Super Micro pulls through.
In that scenario, peak euphoria could kick in and produce an even more devastating collapse.
Of course, that is only if Bitcoin doesn’t just shoot past its weekly 50 EMA and successfully bounce off it on a retest. But we’ll cross that bridge once we get there.
Author

Zorrays Junaid
Alchemy Markets
Zorrays Junaid has extensive combined experience in the financial markets as a portfolio manager and trading coach. More recently, he is an Analyst with Alchemy Markets, and has contributed to DailyFX and Elliott Wave Forecast in the past.



