Cardano Price Forecast: ADA struggles as mixed signals cap upside momentum
- Cardano price trades below $0.240 on Monday, after falling by 5.5% the previous week.
- Mixed signals with a slight bearish tilt on the derivatives markets, cap ADA recovery.
- The technical outlook suggests deeper losses, as momentum indicators signal a bearish bias.

Cardano (ADA) price struggles on Monday, trading below $0.240 after falling 5.5% last week. Mixed signals with a slight bearish bias from the derivatives market, coupled with weakening momentum indicators, suggest a possibility of deeper losses in ADA this week.
Cardano’s derivatives data shows a slight bearish bias
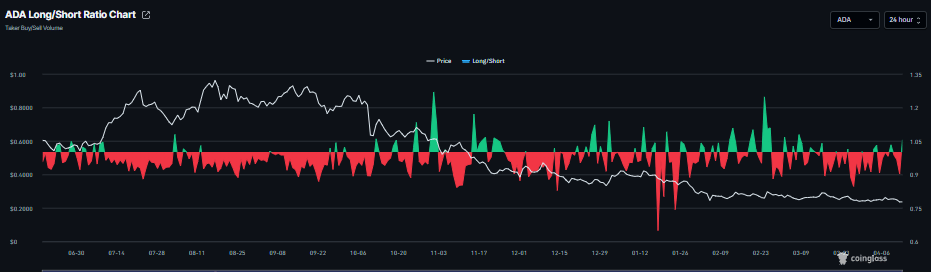
Cardano’s derivatives data shows mixed signals with a slight bearish tilt. CoinGlass’ long-to-short ratio for ADA reads 1.05 on Monday. This ratio, being above one, reflects bullish sentiment in the market, as more traders are betting on the asset’s price to rally.
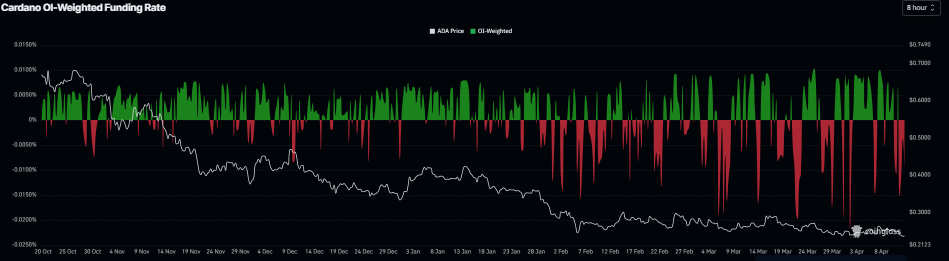
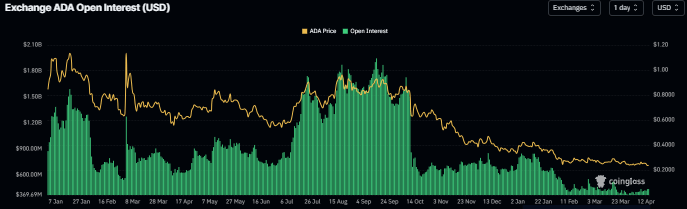
Meanwhile, the funding rates and the Open Interest (OI) data supports a bearish thesis. CoinGlass’ OI-Weighted Funding Rate data for Cardano flipped negative on Sunday and reads -0.0093% on Monday, indicating that shorts are paying the longs and projecting a bearish outlook. In addition, the OI for ADA has been in a downward trend since mid-January and reads $438.11 million on Monday, indicating fading investor participation.
This combination suggests indecision among Cardano investors with a mid-bearish bias, which limits the chances of a sustained recovery.
Cardano Price Forecast: ADA slips below key support zone
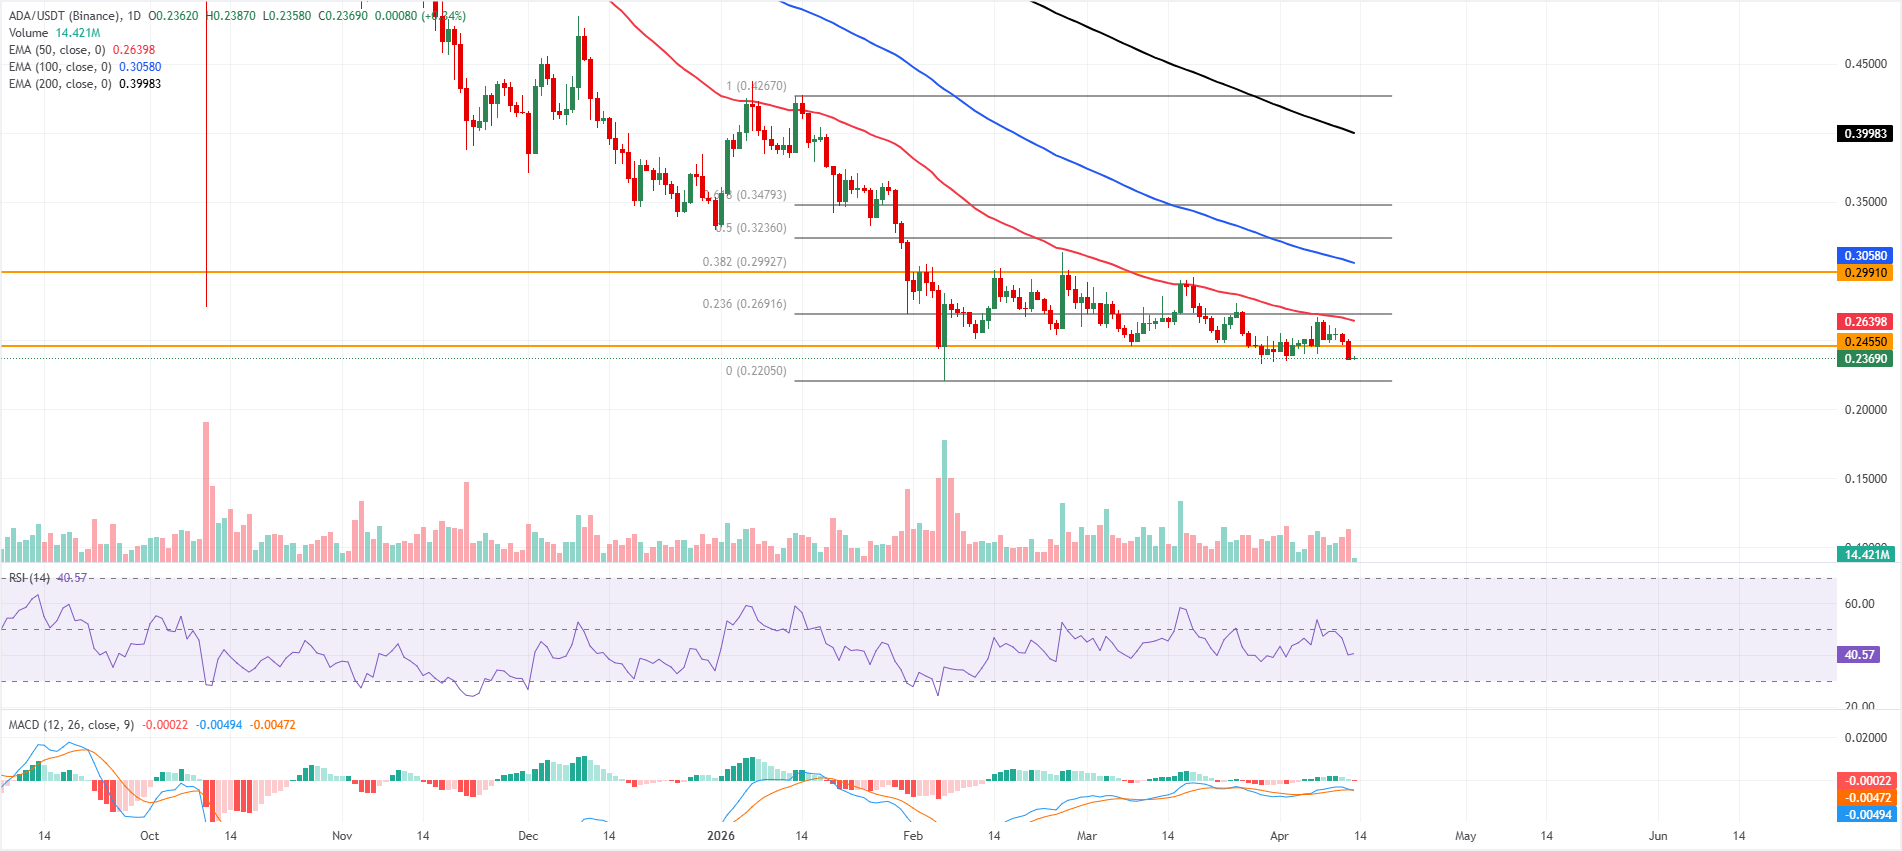
Cardano price is trading at $0.236, maintaining a clear bearish tone as it holds below the 50-day, 100-day, and 200-day Exponential Moving Averages (EMAs), which stack overhead as dynamic resistance. The Relative Strength Index (RSI) on the daily chart around 41 stays in weak territory, while the Moving Average Convergence Divergence (MACD) has slipped marginally below zero, both suggesting that downside pressure persists even as immediate selling momentum is not extreme.
On the topside, initial resistance emerges near $0.245 from a prior horizontal barrier, ahead of the 50-day EMA around $0.264 and the 23.6% Fibonacci retracement at roughly $0.269. Further up, a confluence zone forms between the horizontal cap at $0.299, the 38.2% retracement at $0.299 and the 100-day EMA near $0.305, while higher Fibonacci levels and the 200-day EMA around $0.399 outline a broader bearish ceiling.
On the downside, the only notable structural support in view sits at the Fibonacci cycle low anchor near $0.220, where buyers may attempt to slow any further retreat.
(The technical analysis of this story was written with the help of an AI tool.)
Author

Manish Chhetri
FXStreet
Manish Chhetri is a crypto specialist with over four years of experience in the cryptocurrency industry.




