Cardano Price Forecast: ADA slips below consolidation range as risk-off sentiment weighs
- Cardano price extends losses below $0.250, nearly erasing the recovery since early February.
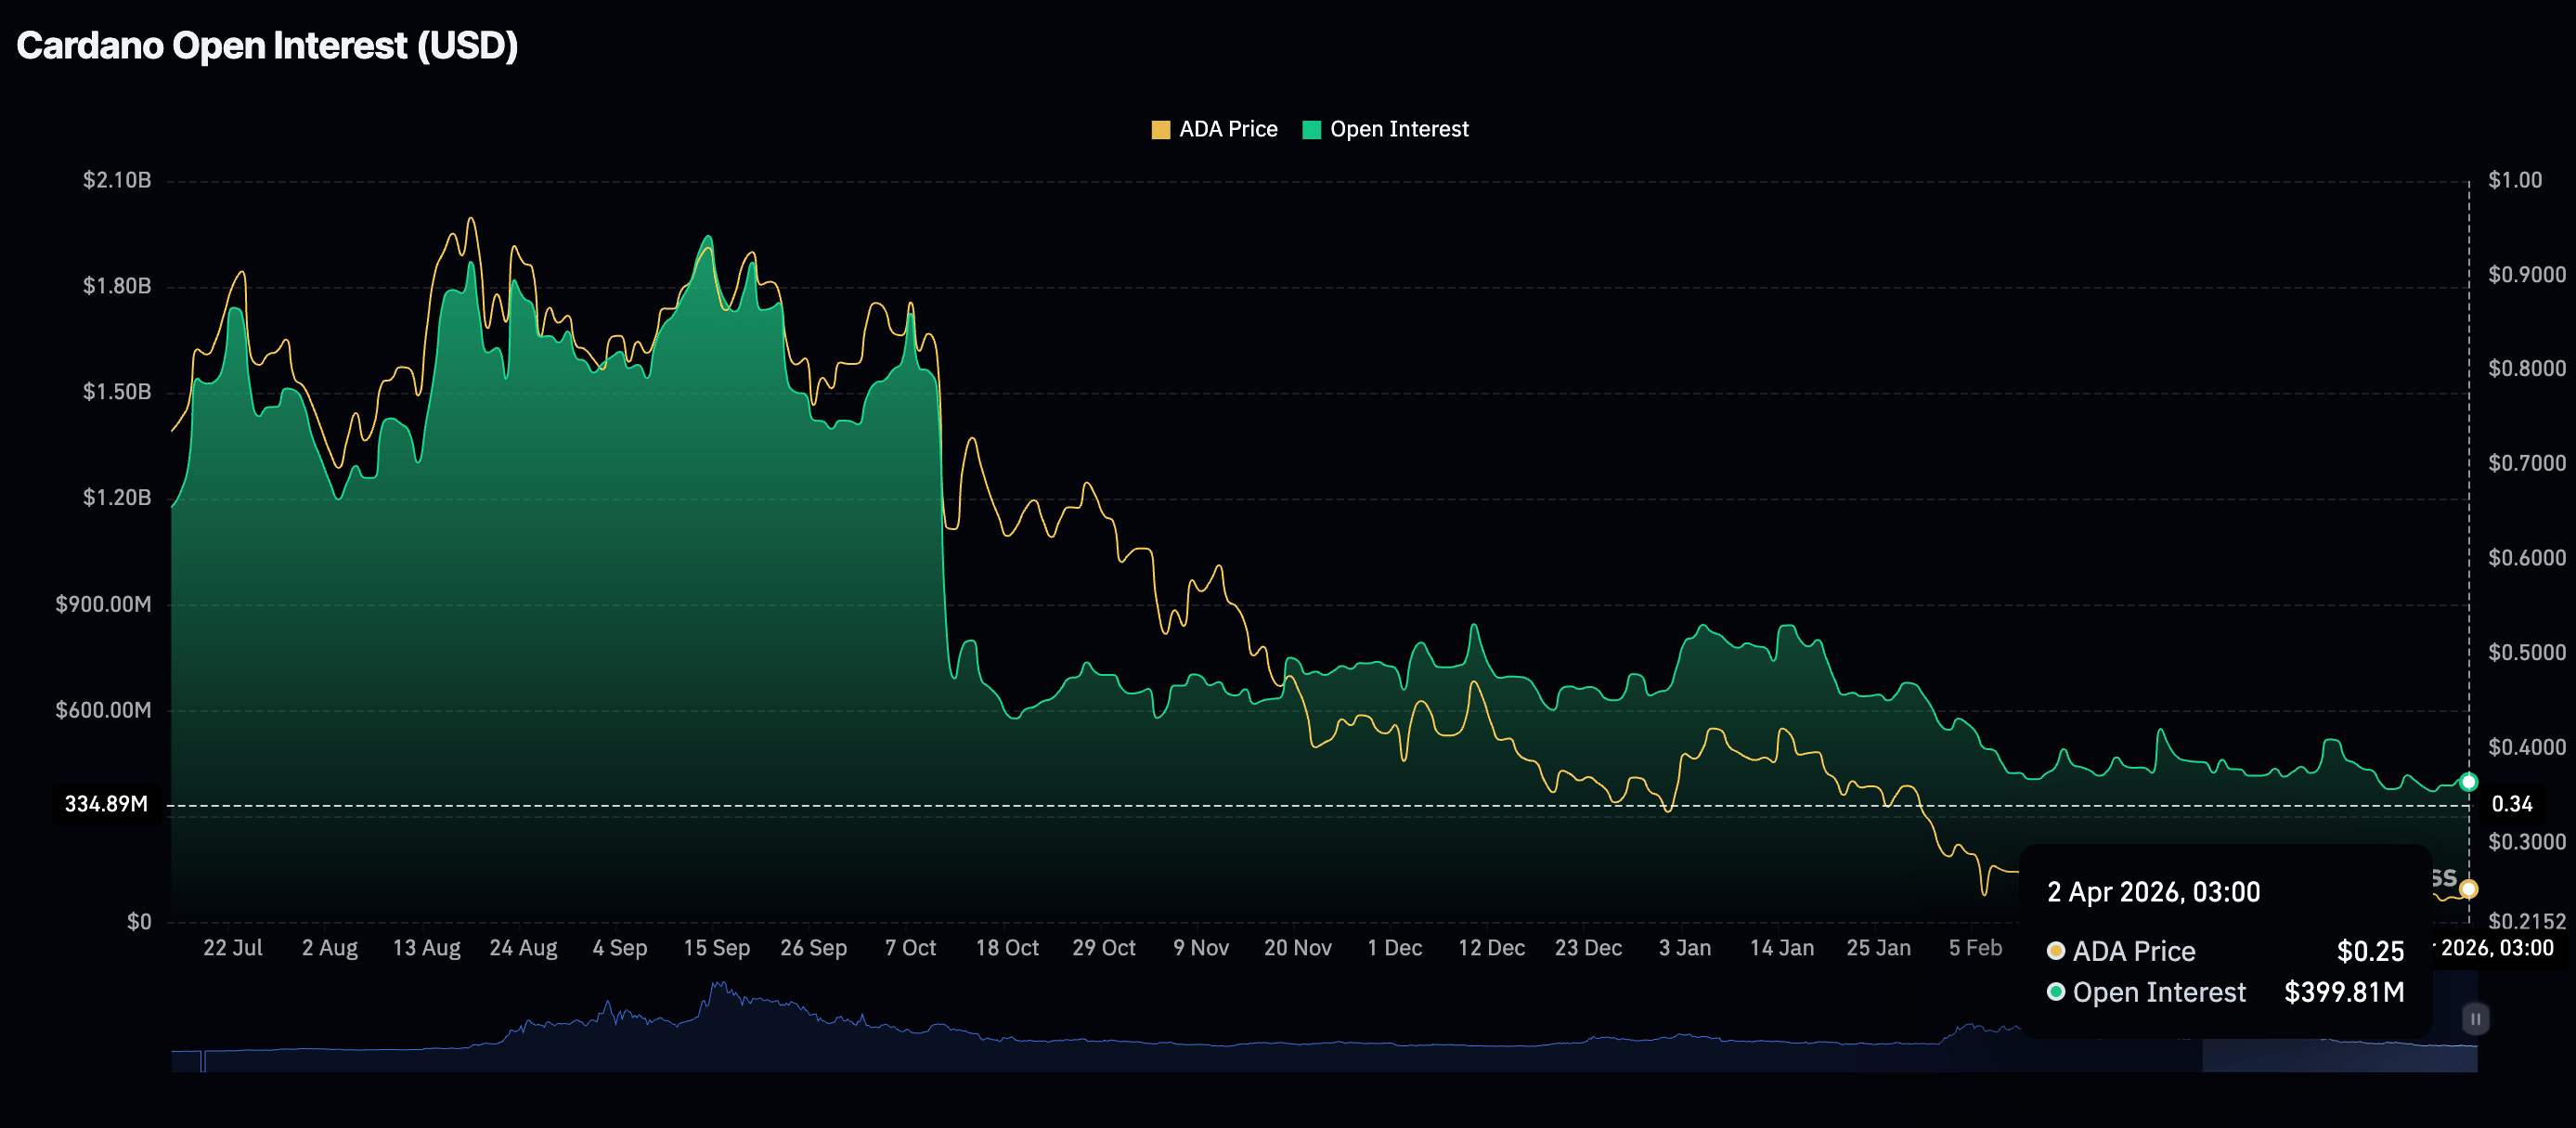
- Risk appetite deteriorates as futures Open Interest falls below $400 million.
- ADA exhibits bearish momentum with the MACD reinforcing a sell signal and the RSI approaching oversold territory.

Cardano (ADA) is edging lower, trading at $0.235 at the time of writing on Thursday, as crypto prices broadly decline amid war-driven, risk-off sentiment. The smart contracts token hovers below key momentum indicators, signaling a higher probability for persistent correction rather than an immediate trend reversal.
Cardano under pressure as retail demand fades
Interest in Cardano has remained significantly subdued since the October 10 deleveraging event, which left many investors counting losses. CoinGlass data shows futures Open Interest (OI) falling slightly below $400 million on Thursday, from nearly $407 million the previous day.
In contrast, the ADA futures OI averaged $1.51 billion on October 10, with the massive drop suggesting that speculative activity is cooling. Persistent low futures OI signals a lack of conviction, as traders are unwilling to open new positions, making it difficult to sustain the buying pressure required to break dense supply levels.
Technical outlook: Cardano extends losses amid fragile technicals
Cardano has broken below a crucial consolidation range and is trading around $0.235 at the time of writing on Thursday. Its near-term bias is bearish as price extends its rejection of the long-standing descending resistance trendline, which currently caps advances just above $0.260.
The smart contract token hovers well below the 50-day, 100-day and 200-day Exponential Moving Averages (EMAs), which all slope lower and reinforce the dominant downtrend. Moreover, the Moving Average Convergence Divergence (MACD) indicator is below its signal line on the daily chart, with a slightly negative histogram, suggesting fading bullish momentum and renewed downside pressure. The Relative Strength Index (RSI) near 38 on the same chart signals weak momentum without reaching oversold extremes, leaving room for further declines.
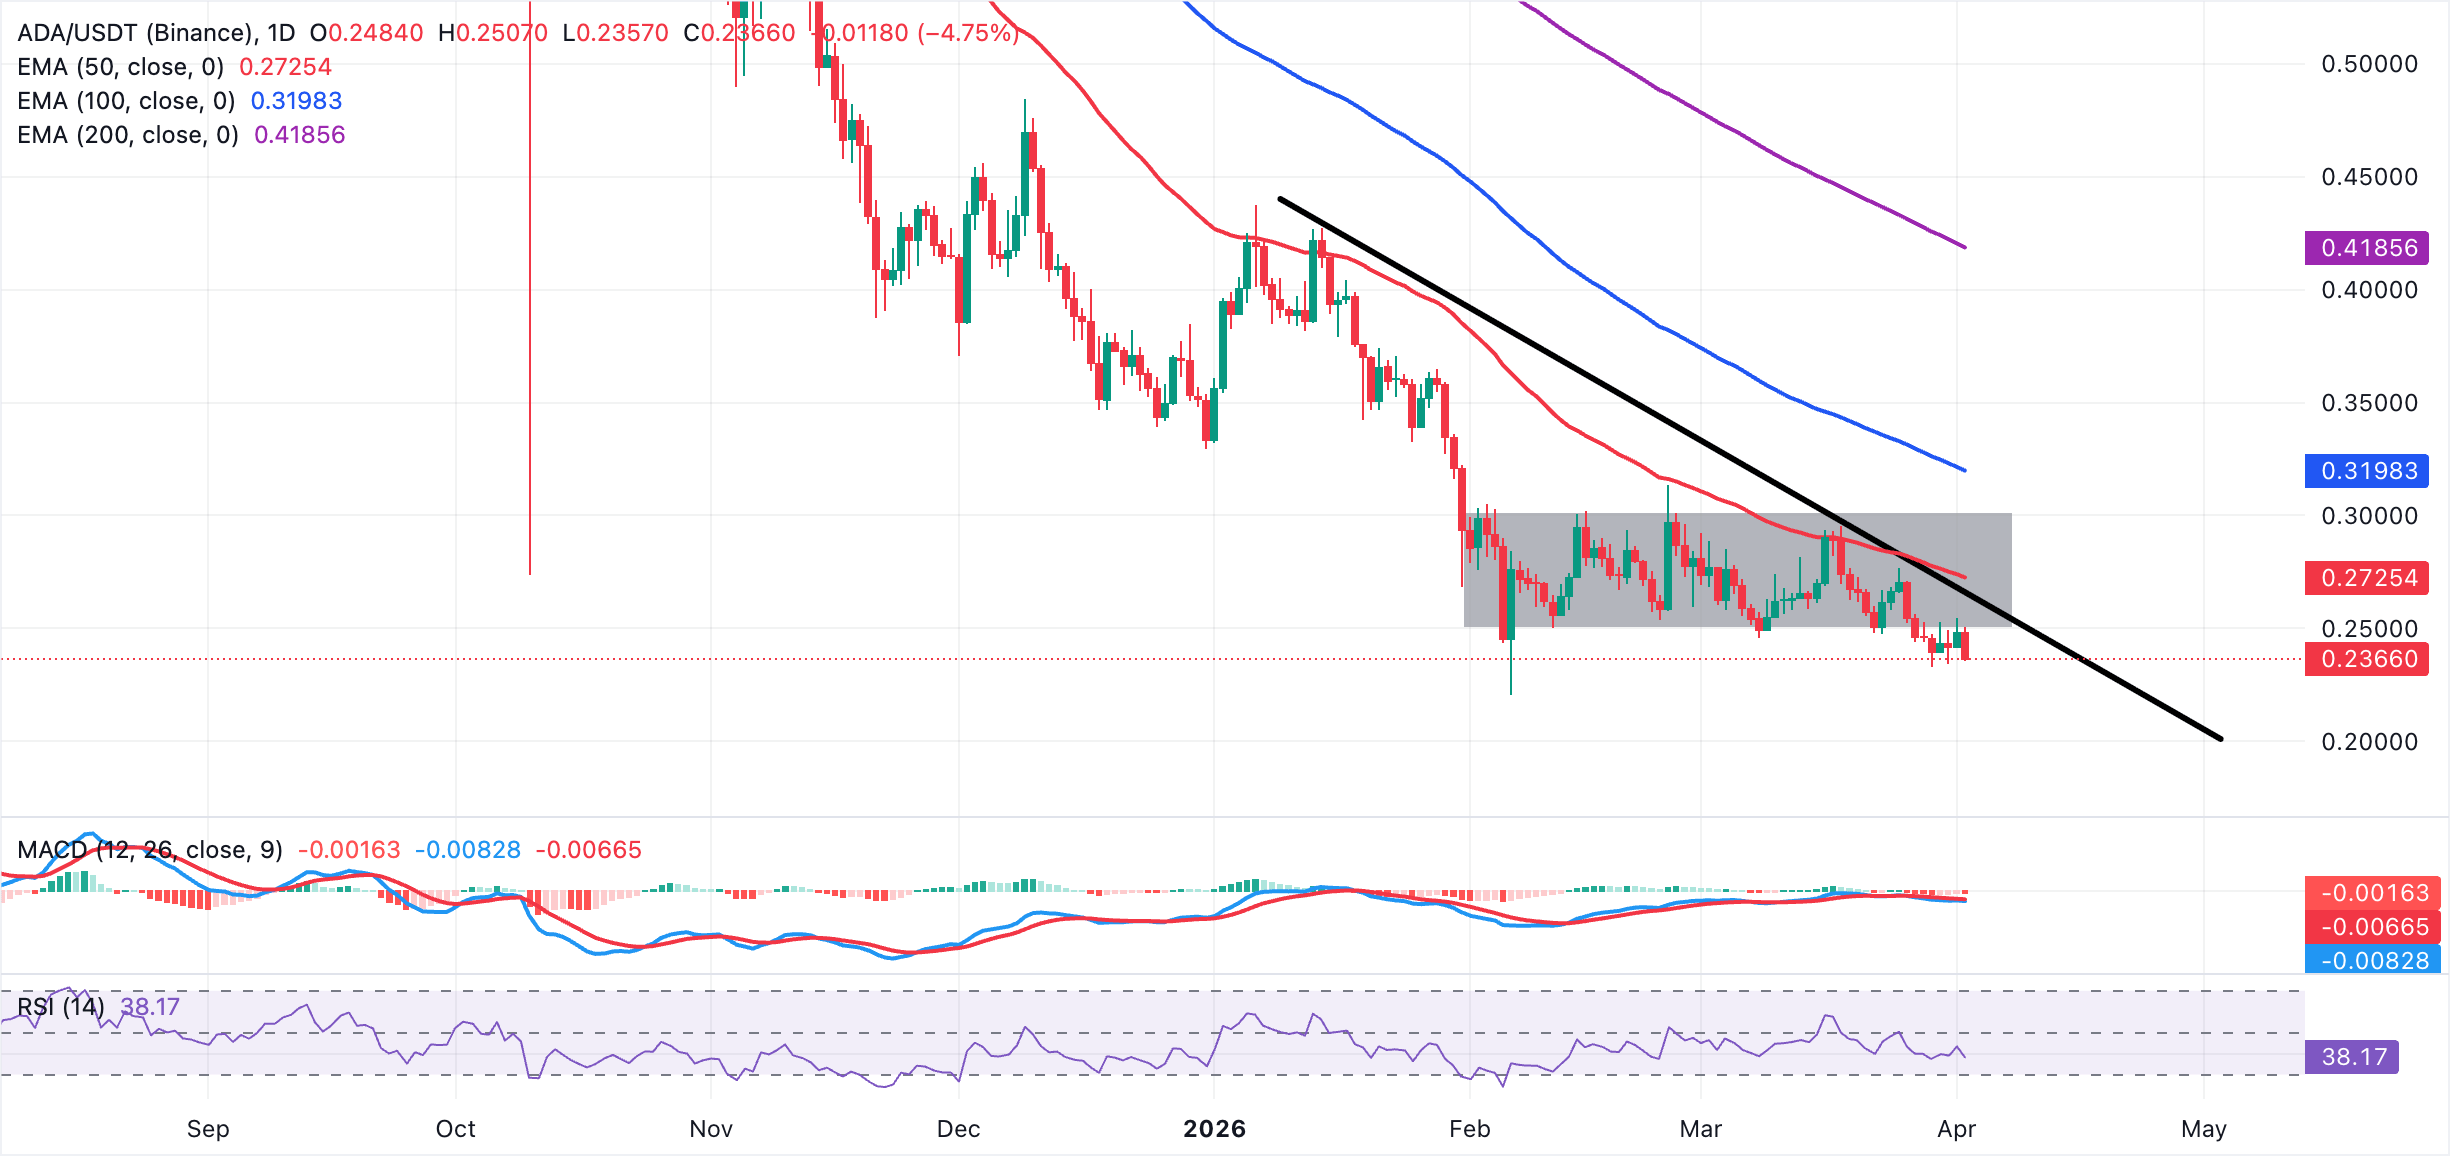
ADA's immediate resistance lies around $0.245–$0.250, ahead of the descending trendline zone near $0.265, which guards the upside before the 50-day EMA near $0.270. On the downside, initial support is seen at the $0.230 region, with a break below exposing the $0.220 area, and then $0.210 as the next bearish target. This is where sellers would look to extend the broader downtrend unless buyers reclaim and hold above the $0.265 trendline barrier.
Cryptocurrency prices FAQs
Token launches influence demand and adoption among market participants. Listings on crypto exchanges deepen the liquidity for an asset and add new participants to an asset’s network. This is typically bullish for a digital asset.
A hack is an event in which an attacker captures a large volume of the asset from a DeFi bridge or hot wallet of an exchange or any other crypto platform via exploits, bugs or other methods. The exploiter then transfers these tokens out of the exchange platforms to ultimately sell or swap the assets for other cryptocurrencies or stablecoins. Such events often involve an en masse panic triggering a sell-off in the affected assets.
Macroeconomic events like the US Federal Reserve’s decision on interest rates influence crypto assets mainly through the direct impact they have on the US Dollar. An increase in interest rate typically negatively influences Bitcoin and altcoin prices, and vice versa. If the US Dollar index declines, risk assets and associated leverage for trading gets cheaper, in turn driving crypto prices higher.
Halvings are typically considered bullish events as they slash the block reward in half for miners, constricting the supply of the asset. At consistent demand if the supply reduces, the asset’s price climbs.
(The technical analysis of this story was written with the help of an AI tool.)
Author

John Isige
FXStreet
John Isige is a seasoned cryptocurrency journalist and markets analyst committed to delivering high-quality, actionable insights tailored to traders, investors, and crypto enthusiasts. He enjoys deep dives into emerging Web3 tren



