Cardano Price Forecast: ADA extends rebound amid growing retail demand
- Cardano trades above $0.265, rising alongside the broader crypto market on Friday.
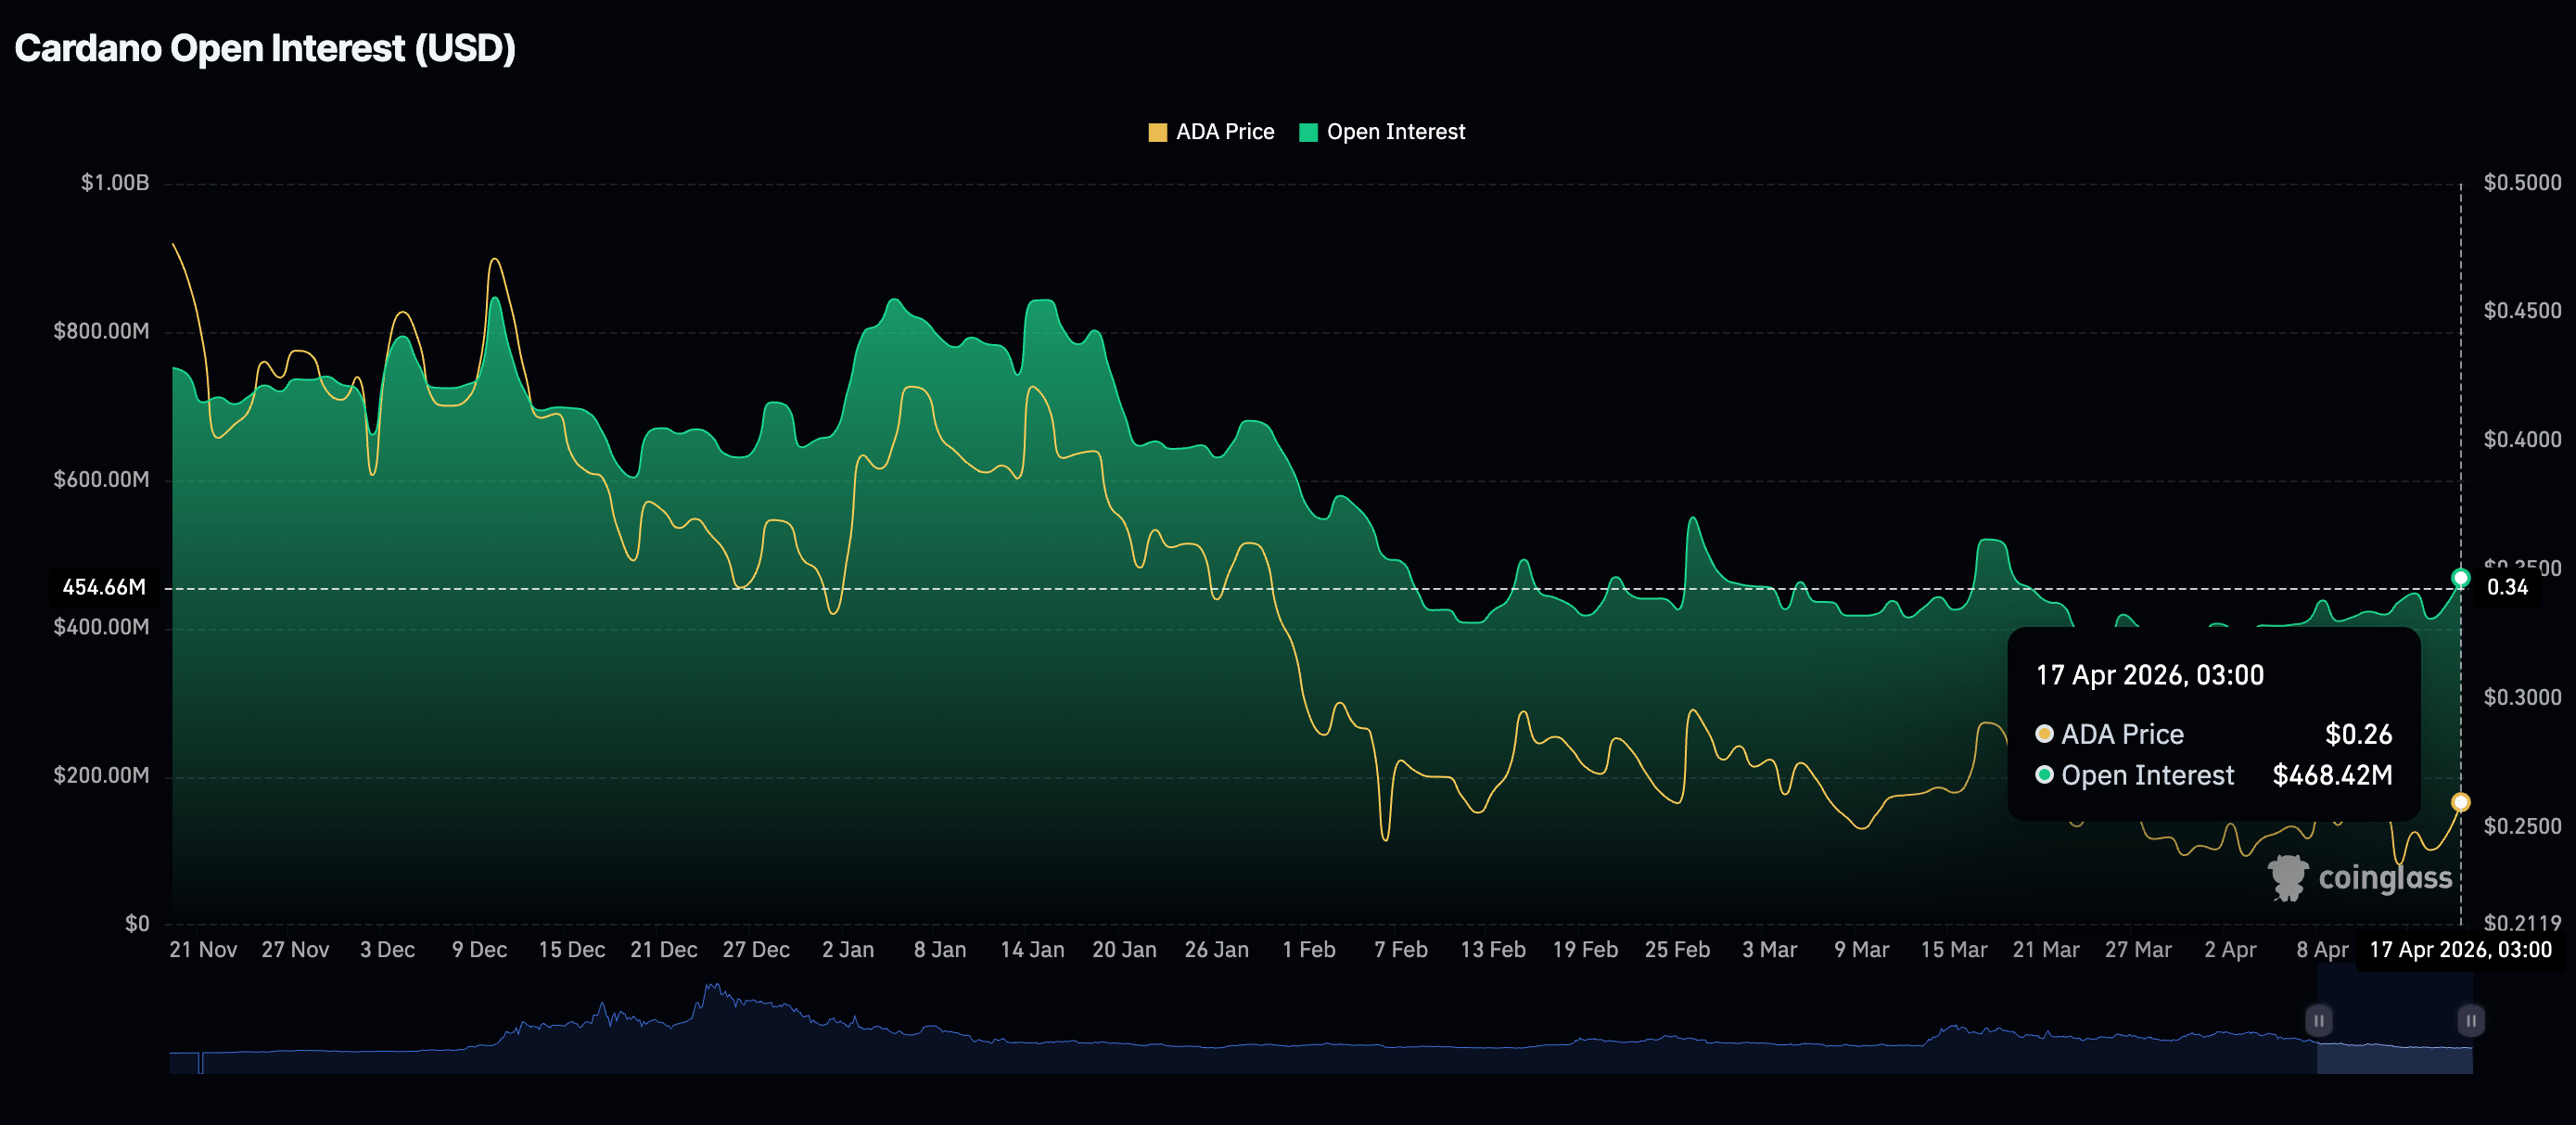
- The ADA derivatives market gains momentum as futures Open Interest climbs to $468 million.
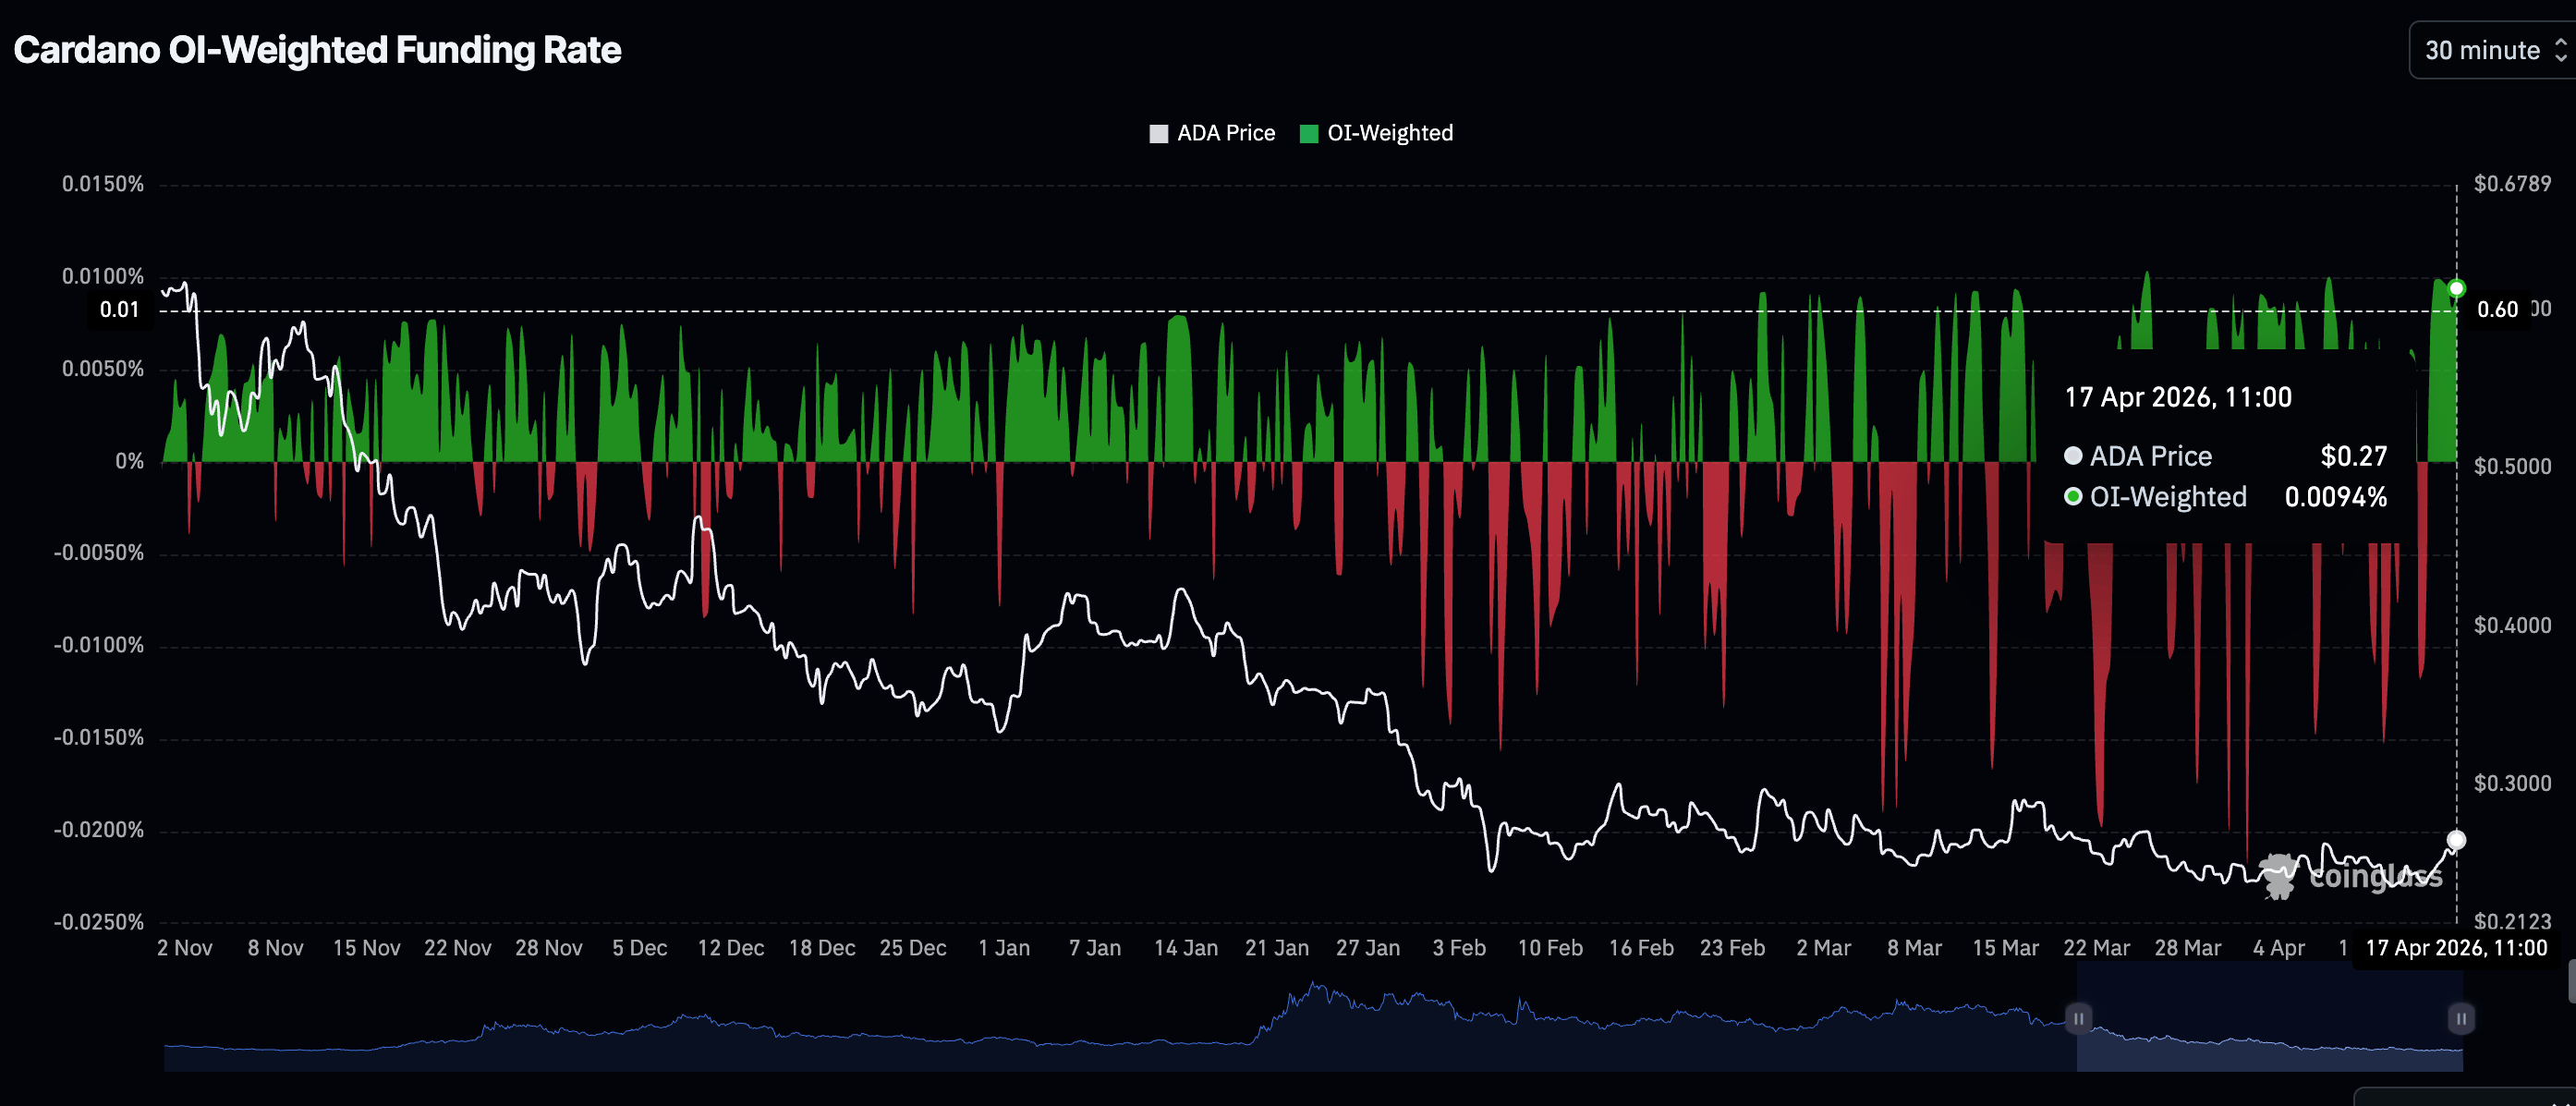
- ADA investors are increasingly piling into long positions, as the Open Interest-Weighted Funding Rate holds in positive territory.

Cardano (ADA) grinds higher, trading above $0.265 at the time of writing on Friday, as crypto prices broadly rise, buoyed by improving sentiment after Iran’s announcement that the Strait of Hormuz has been opened and will remain open during the ceasefire.
The West Texas Intermediary (WTI) Oil is trading around $79, down from the daily open of around $90. The reopening of the Strait of Hormuz is expected to ease pressure on global Oil and Gas supplies.
Renewed retail interest fuels Cardano recovery
Cardano is experiencing a surge in retail participation, driving Open Interest (OI) to $468 million on Friday, up from roughly $431 million the previous day.
On April 1, the OI averaged $406 million, underscoring growing risk appetite and retail capital influx. ADA requires a highly concentrated retail market to sustain short to medium-term gains.
Still in the derivatives market, traders appear to be increasingly betting on an advance in the Cardano price, as the OI-Weighted Funding Rate remains in positive territory at 0.0089% on Friday. If risk appetite expands further, the likelihood of ADA closing the gap to $0.30 would increase significantly.
Technical outlook: Cardano breakout in focus
Cardano trades at $0.265, holding a weakly bearish stance as price remains capped beneath the 100-day and 200-day Exponential Moving averages (EMAs) at $0.302 and $0.393, respectively. Nonetheless, the pair trades above the 50-day EMA at $0.263. The broken downward trendline has turned into support near $0.248, hinting at an attempted base-building phase.
Moreover, the Relative Strength Index (RSI) near 56 signals mildly positive momentum, while the Moving Average Convergence Divergence (MACD) is positive, reinforcing that downside pressure is easing rather than accelerating.
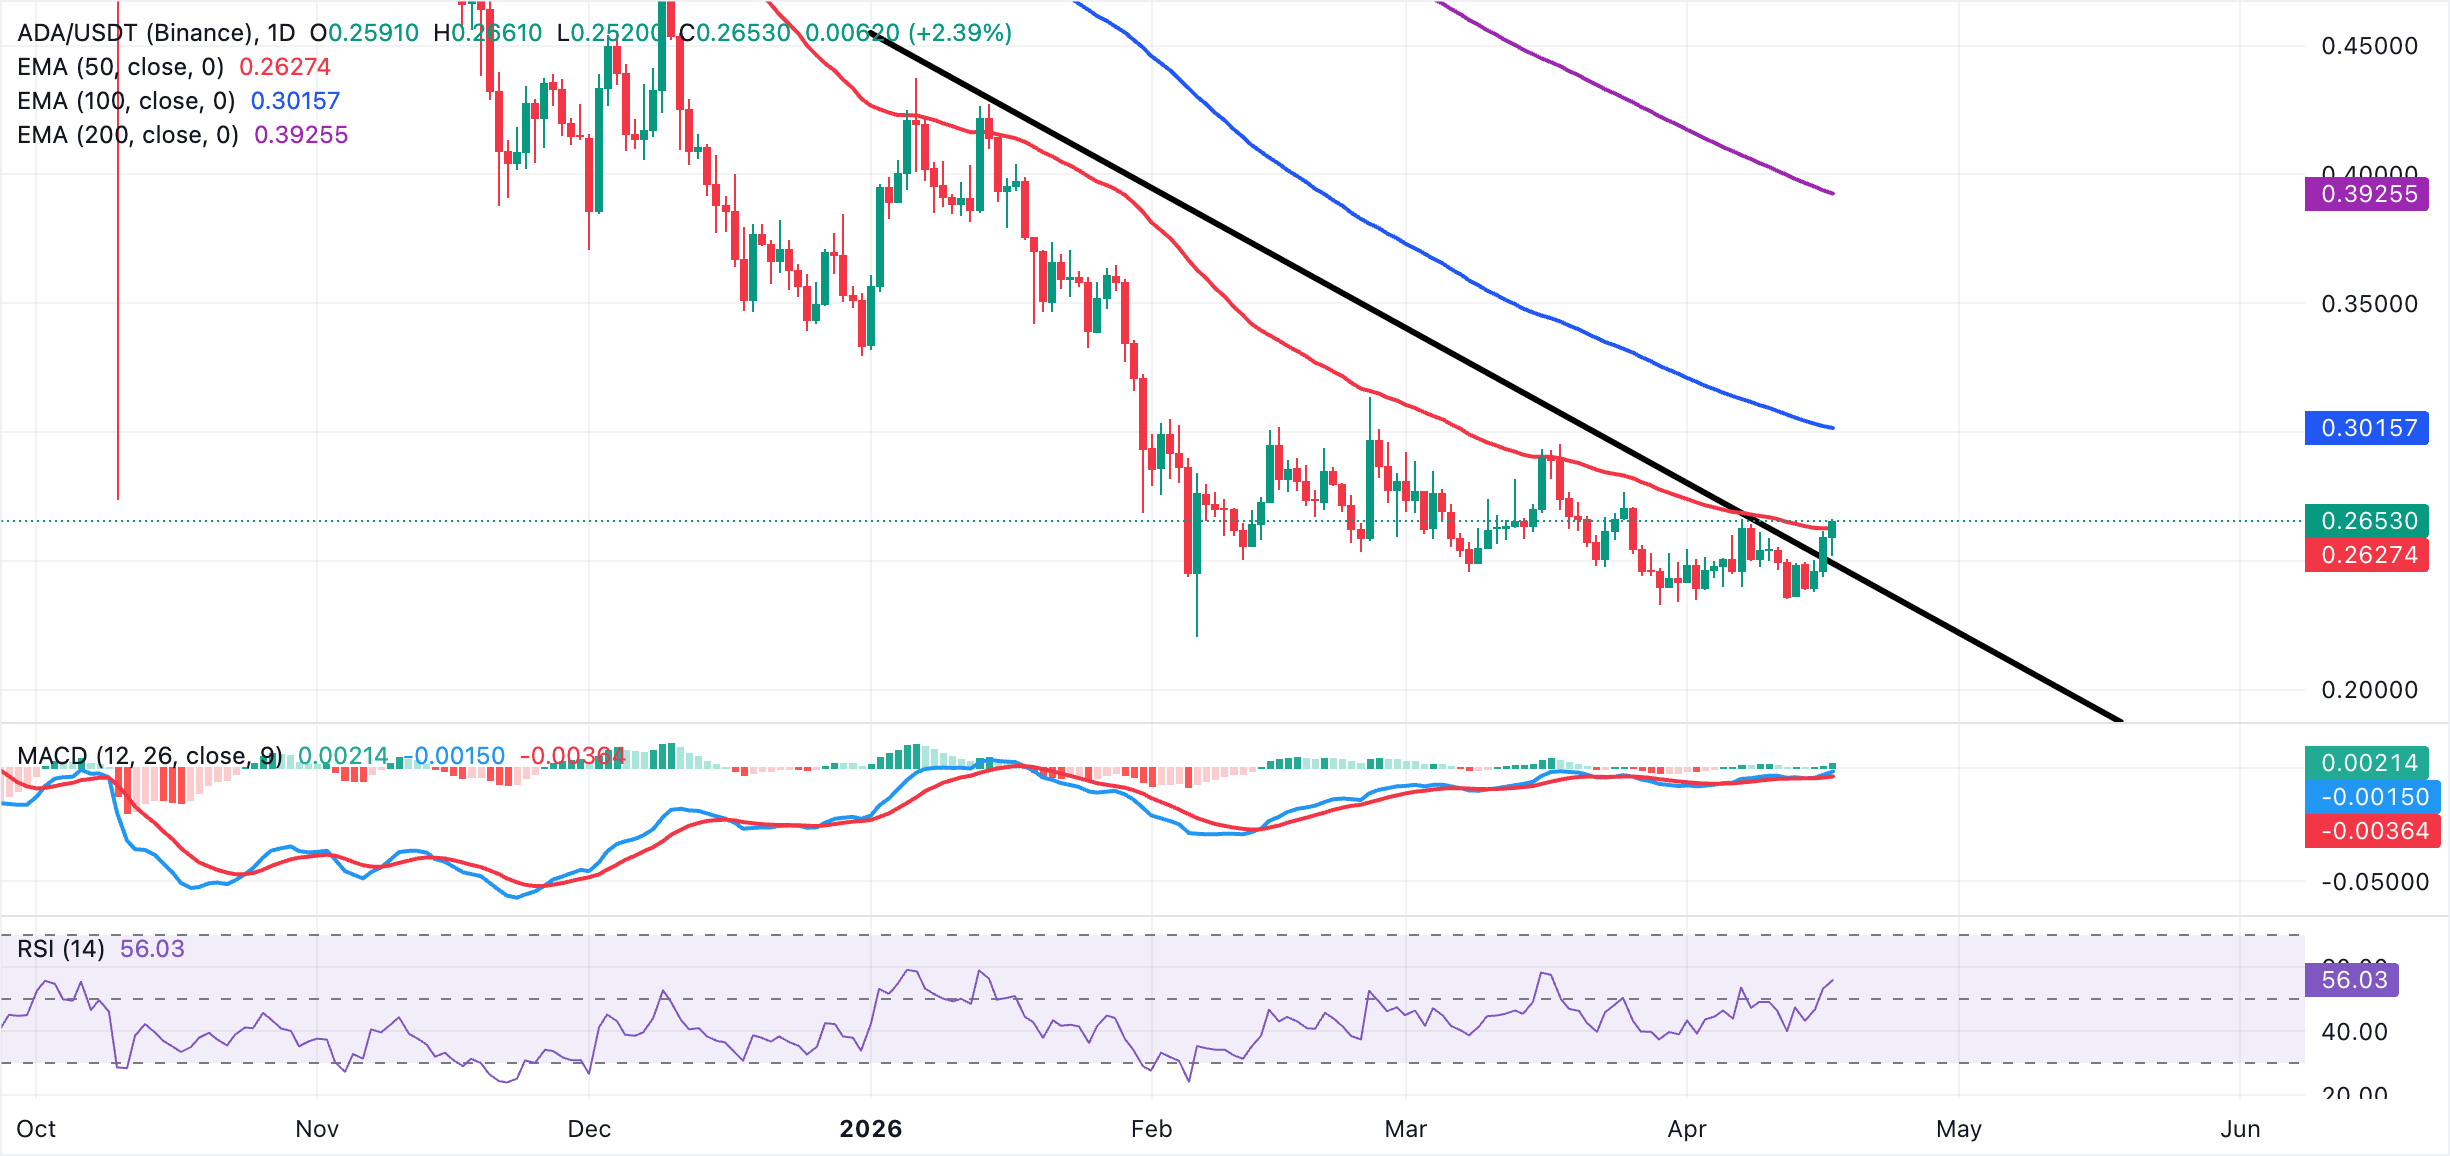
On the topside, initial resistance lies at the 100-day EMA around $0.301, where a daily close above would be needed to ease the broader bearish structure. The 200-day EMA at $0.393 acts as a more distant bullish target and a medium-term barrier. On the downside, immediate support is seen at the 50-day EMA at $0.263, followed by the former descending trendline break level near $0.248. A drop back below this latter zone would reopen the path toward the weekly open at $0.236.
Open Interest, funding rate FAQs
Higher Open Interest is associated with higher liquidity and new capital inflow to the market. This is considered the equivalent of increase in efficiency and the ongoing trend continues. When Open Interest decreases, it is considered a sign of liquidation in the market, investors are leaving and the overall demand for an asset is on a decline, fueling a bearish sentiment among investors.
Funding fees bridge the difference between spot prices and prices of futures contracts of an asset by increasing liquidation risks faced by traders. A consistently high and positive funding rate implies there is a bullish sentiment among market participants and there is an expectation of a price hike. A consistently negative funding rate for an asset implies a bearish sentiment, indicating that traders expect the cryptocurrency’s price to fall and a bearish trend reversal is likely to occur.
(The technical analysis of this story was written with the help of an AI tool.)
Author

John Isige
FXStreet
John Isige is a seasoned cryptocurrency journalist and markets analyst committed to delivering high-quality, actionable insights tailored to traders, investors, and crypto enthusiasts. He enjoys deep dives into emerging Web3 tren



