Can Bitcoin defy 5.2% Treasury yields?
- BTC eases back to 83k after 4% gains last week.
- Oil rises, and Treasury yields rise to a fresh 19-year high.
- US inflation and labour market data this week could cement an October Fed rate hike.
- BTC ETFs at highest level since last October.
- BTC technical analysis.

After a 4% rally last week, Bitcoin is continuing to lose momentum on Monday, cooling following an impressive rally in recent weeks. Rising macro uncertainty is weighing on risk assets, including crypto, offsetting solid ETF inflows.
Bitcoin trades down 2% over the past 24 hours at $83K. Other cryptocurrencies are also under pressure, with Ether falling 1.8% over the same period to $2,660. The total cryptocurrency market cap is down 2% at $2.85 trillion.
The macro backdrop is weighing on risk sentiment across the board. U.S. futures are also pointing to a weaker start, with Nasdaq futures down 0.9%.
Oil jumps and Treasury yields hit 19-year high
The leg lower comes after President Trump rejected Iran's latest proposal to reopen the Strait of Hormuz and warned that the U.S. could resume bombing Iran after the midterm elections. Fading hopes of diplomacy in the Middle East and the prospect of a longer war sent oil prices over 2% higher, adding to inflationary concerns.
This comes as the Federal Reserve hiked interest rates by 25 basis points this month, while hawkish Fed speakers last week and strong U.S. data have the market pricing in a 70% probability of another rate hike in October.
As a result, U.S. Treasury yields are heading higher, with the 10-year yield at 5.23%, a level last seen in 2007. High yields dampen demand for risk assets such as crypto, while also lifting the U.S. dollar, which trades around a two-month high.
US inflation and jobs data on tap
This week is a busy one for U.S. economic data, which could cement expectations for an October rate hike. Core PCE, the Fed's preferred gauge for inflation, is expected to tick higher, while the non-farm payroll report is expected to show that the U.S. labour market remains in strong standing.
Sticky inflation combined with strong economic data could see markets price in a higher probability of another Fed rate hike. Bitcoin tends to perform better in a lower interest-rate environment, owing to increased liquidity and a lower opportunity cost of holding risk assets.
Until the Federal Reserve closes the door to further rate hikes, Treasury yields and the dollar fall, and oil prices weaken, Bitcoin's upside could remain limited.
However, despite Bitcoin's recent weakness, this could be a pause after strong gains earlier in the month rather than the end of positive momentum.
BTC price supported by ETF demand, seasonality and sentiment
Strong institutional demand is keeping the Bitcoin price supported. BTC ETF inflows reached $2.39 billion last week, marking the largest weekly inflow since October 10, when the price reached a record high. ETF inflows have now flipped positive for the year after recording over $5 billion in net outflows through the end of July.
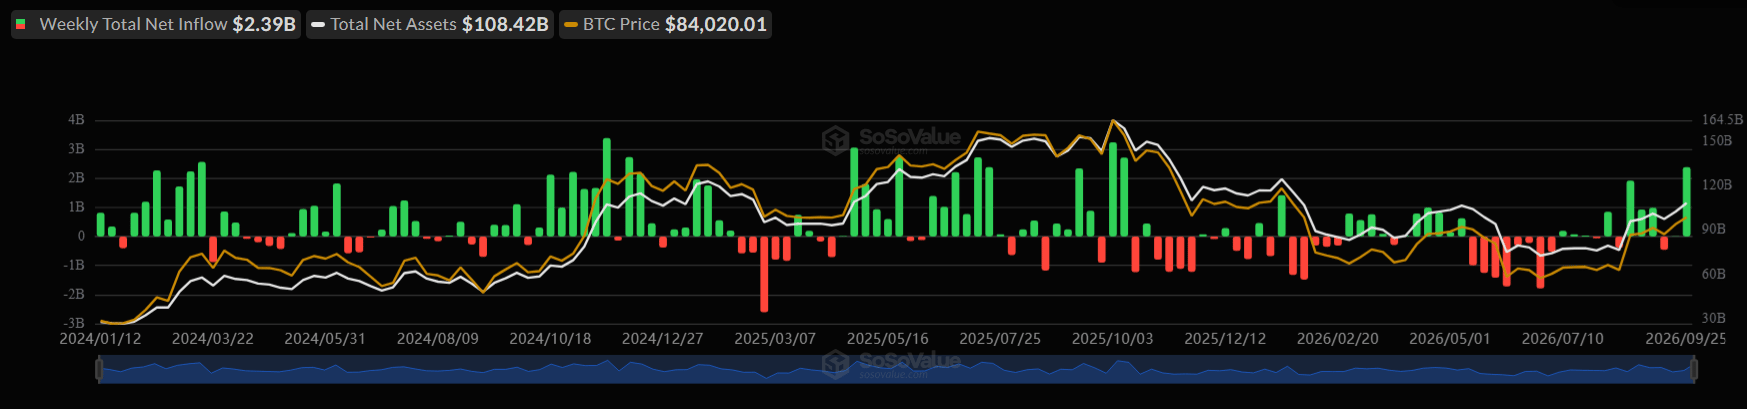
After three straight months of BTC price gains, attention will now turn to October, typically the strongest month for Bitcoin, also referred to as Uptober.
Since 2013, Bitcoin has finished October higher in all but three years. Interestingly, despite the challenging macro backdrop, the Crypto Fear & Greed Index remains elevated at 69, in greed territory.
The question is whether sentiment, institutional demand and seasonality can offset a more challenging macro backdrop and yields above 5%.
Bitcoin technical analysis
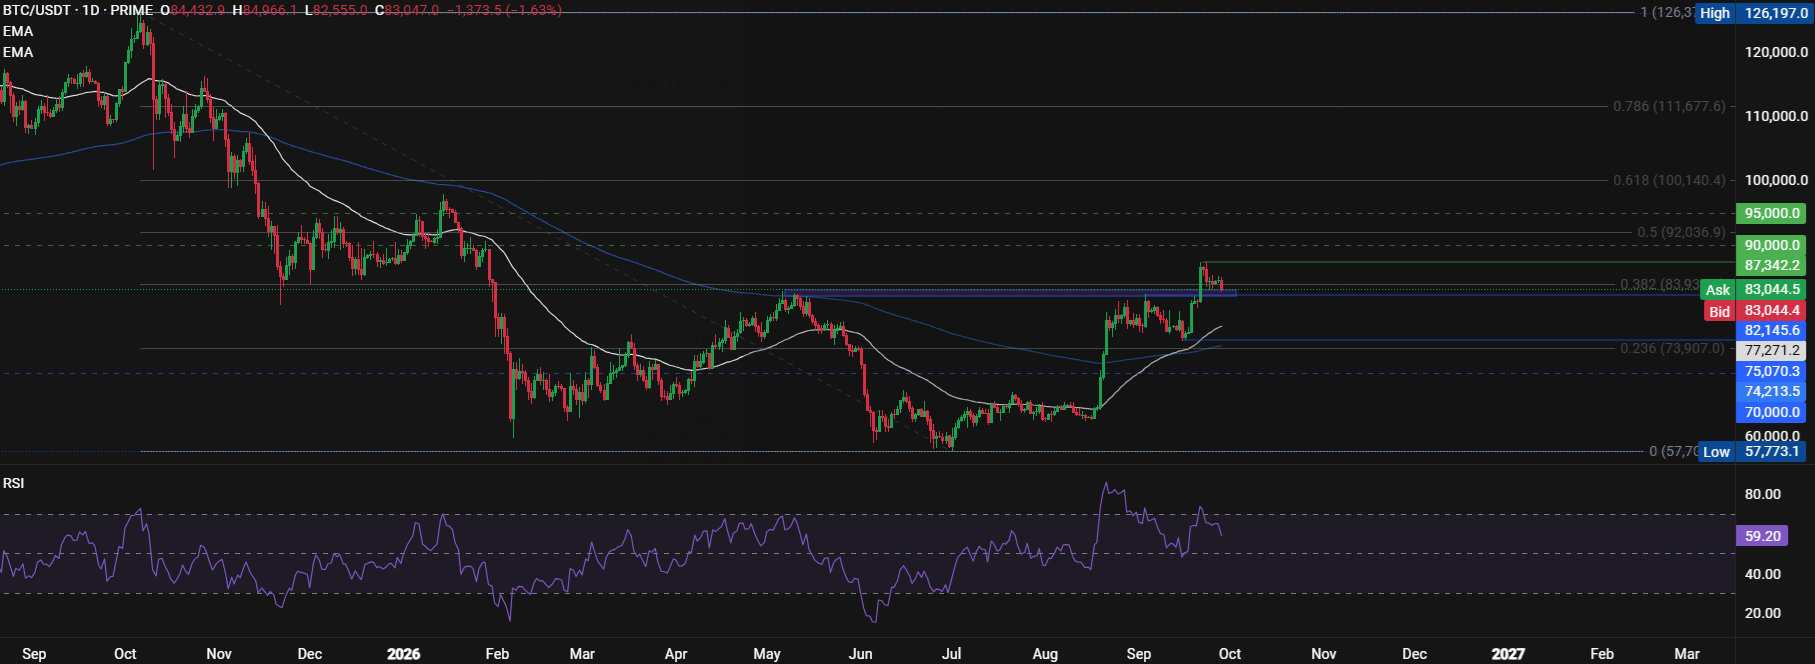
After breaking out and reaching an 8-month high of $87.3K, Bitcoin has eased back and is consolidating around $83K, testing immediate support at the May high. The RSI remains above 50 but is pointing lower as momentum slows, while price continues to hold above the 50- and 200-day EMAs, keeping the longer-term outlook constructive for now.
Should current support hold, buyers will look to break above $87K to create a higher high and turn attention towards $90K, the psychological level. Above here, $92K comes into focus, the 50% Fibonacci retracement of the $126.6K high and $57.7K low, ahead of $95K.
On the downside, a break below $83K would expose a cluster of support, starting with the 50 EMA around $77K, followed by $76K, the lower band of the recent holding pattern. Below here, attention turns to $74K, where the 200 EMA and 23.6% Fibonacci retracement converge. A break below this zone could see sellers gain traction towards $70K.
Start trading with PrimeXBT
Author

PrimeXBT Research Team
PrimeXBT
PrimeXBT is a leading Crypto and CFD broker that offers an all-in-one trading platform to buy, sell and store Cryptocurrencies and trade over 100 popular markets, including Crypto Futures, Copy Trading and CFDs on Crypto, Forex, I




