Bitcoin vs Gold Outlook: BTC pulls back alongside XAU/USD ahead of US-Iran indirect talks
- Bitcoin bears seek to regain control as BTC slides below $84,000.
- XAU extends its decline into the lower $4,100s as focus shifts to the critical $4,000 demand area.
- US and Iran are expected to resume indirect talks on Monday or Tuesday, focusing on Tehran’s seven-day proposal.

Cryptocurrency prices are lethargic on Monday, led by Bitcoin’s (BTC) correction below $84,000. Attempts to restart the uptrend last weekend failed to gather momentum, as BTC was rejected around $85,000. On one hand, holding above the $80,000-82,000 demand range would support the bullish outlook; on the other, losing that support could extend the correction.
Meanwhile, Gold (XAU/USD) trades under pressure, edging lower toward its short-term $4,100 support. The ongoing correction is drawing attention to the $4,000 region, where buyers could reengage and potentially spark a rebound.
US-Iran to commence indirect talks
The United States (US) is expected to resume indirect talks with Iran on Monday or Tuesday, according to a Reuters report citing an official briefed on the discussions. Reportedly, mediators will meet separately with officials from both countries.
Iranian Foreign Minister Abbas Araghchi and Qatari mediators stayed back in the US following the recently concluded United Nations General Assembly (UNGA).
The discussions are expected to center on an amended version of Iran's seven-day proposal. Iran presented the proposal on the sidelines of UNGA, aimed at ending the seven-month war with the US and reopening the Strait of Hormuz.
Despite US President Donald Trump publicly rejecting the terms in the initial proposal, indirect talks led by Qatari mediators are likely to proceed. Some of the demands Iran made included the US lifting the naval blockade on Iranian ports, easing or waiving sanctions on Oil exports and the release of the country’s frozen assets.
Markets broadly show a relatively muted reaction to the latest diplomatic developments, with Bitcoin and Gold extending declines. Meanwhile, West Texas Intermediate (WTI) Oil prices are edging higher and trading around $94.00, up from the daily low of $91.40.
Technical analysis: Bitcoin continues to trim gains
Bitcoin hovers near $83,000 amid a correction from recent highs above $87,000. Despite the correction, the pair maintains a bullish near-term bias as price extends well above the 50-day, 100-day and 200-day Exponential Moving Averages (EMAs), clustered between roughly $73,900 and $77,300.
The SuperTrend line at $78,352 also sits below spot, reinforcing an underlying demand zone after the recent breakout. Momentum remains constructive, with the Relative Strength Index (RSI) holding near 60 and Moving Average Convergence Divergence (MACD) positive, suggesting buyers still control the tape even as the pair consolidates below recent highs.
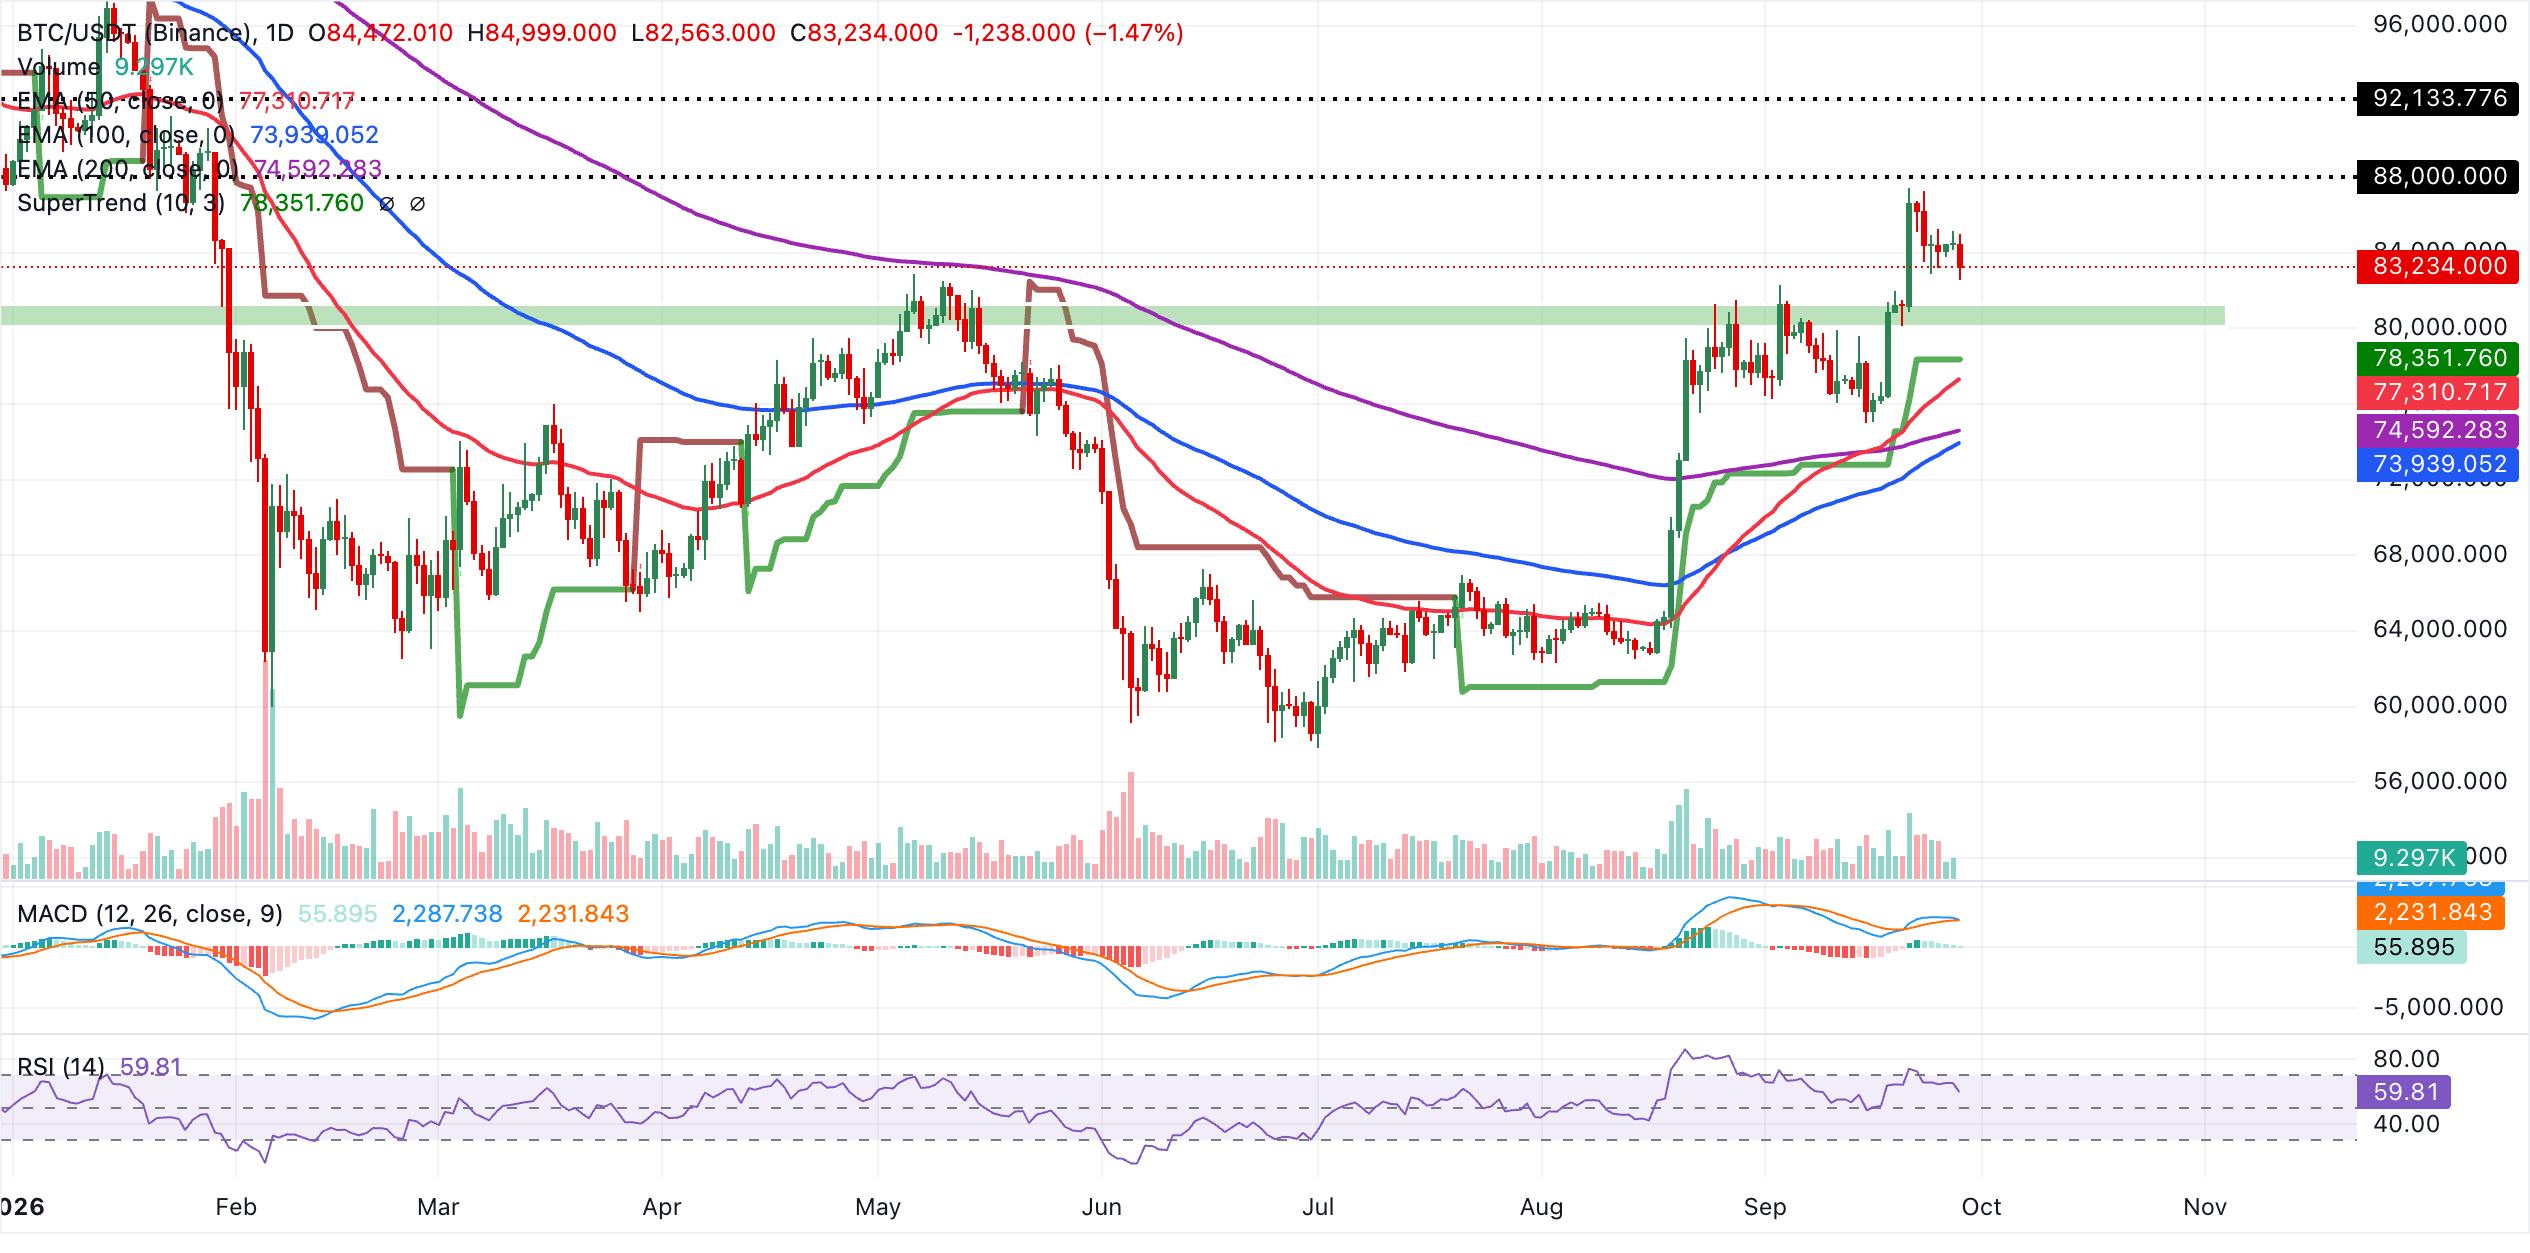
On the downside, initial support emerges from the SuperTrend area around $78,352, followed by the 50-day EMA near $77,311, where dip-buying interest would be expected on a deeper pullback. Below that, a broader structural floor is defined by the 100-day EMA at $73,939 and the 200-day EMA at $74,592, which together underpin the prevailing bullish trend as long as BTC holds above the cluster.
Gold technical analysis: XAU/USD decline persists
Gold trades at $4,122, keeping a bearish near-term bias as price holds well below the stacked moving averages, with the 50-day EMA at $4,329, the 200-day EMA at $4,316 and the 100-day EMA at $4,352 all acting as overhead resistance.
The SuperTrend at $4,491 and the downward resistance trend line, whose key break level sits near $4,482, reinforce the idea of Gold being capped on rebounds. Momentum remains weak, with the MACD below zero, hinting at sustained downside pressure. Still, the RSI near 35 approaches oversold territory, suggesting that while selling dominates, the pace of the decline could start to moderate.
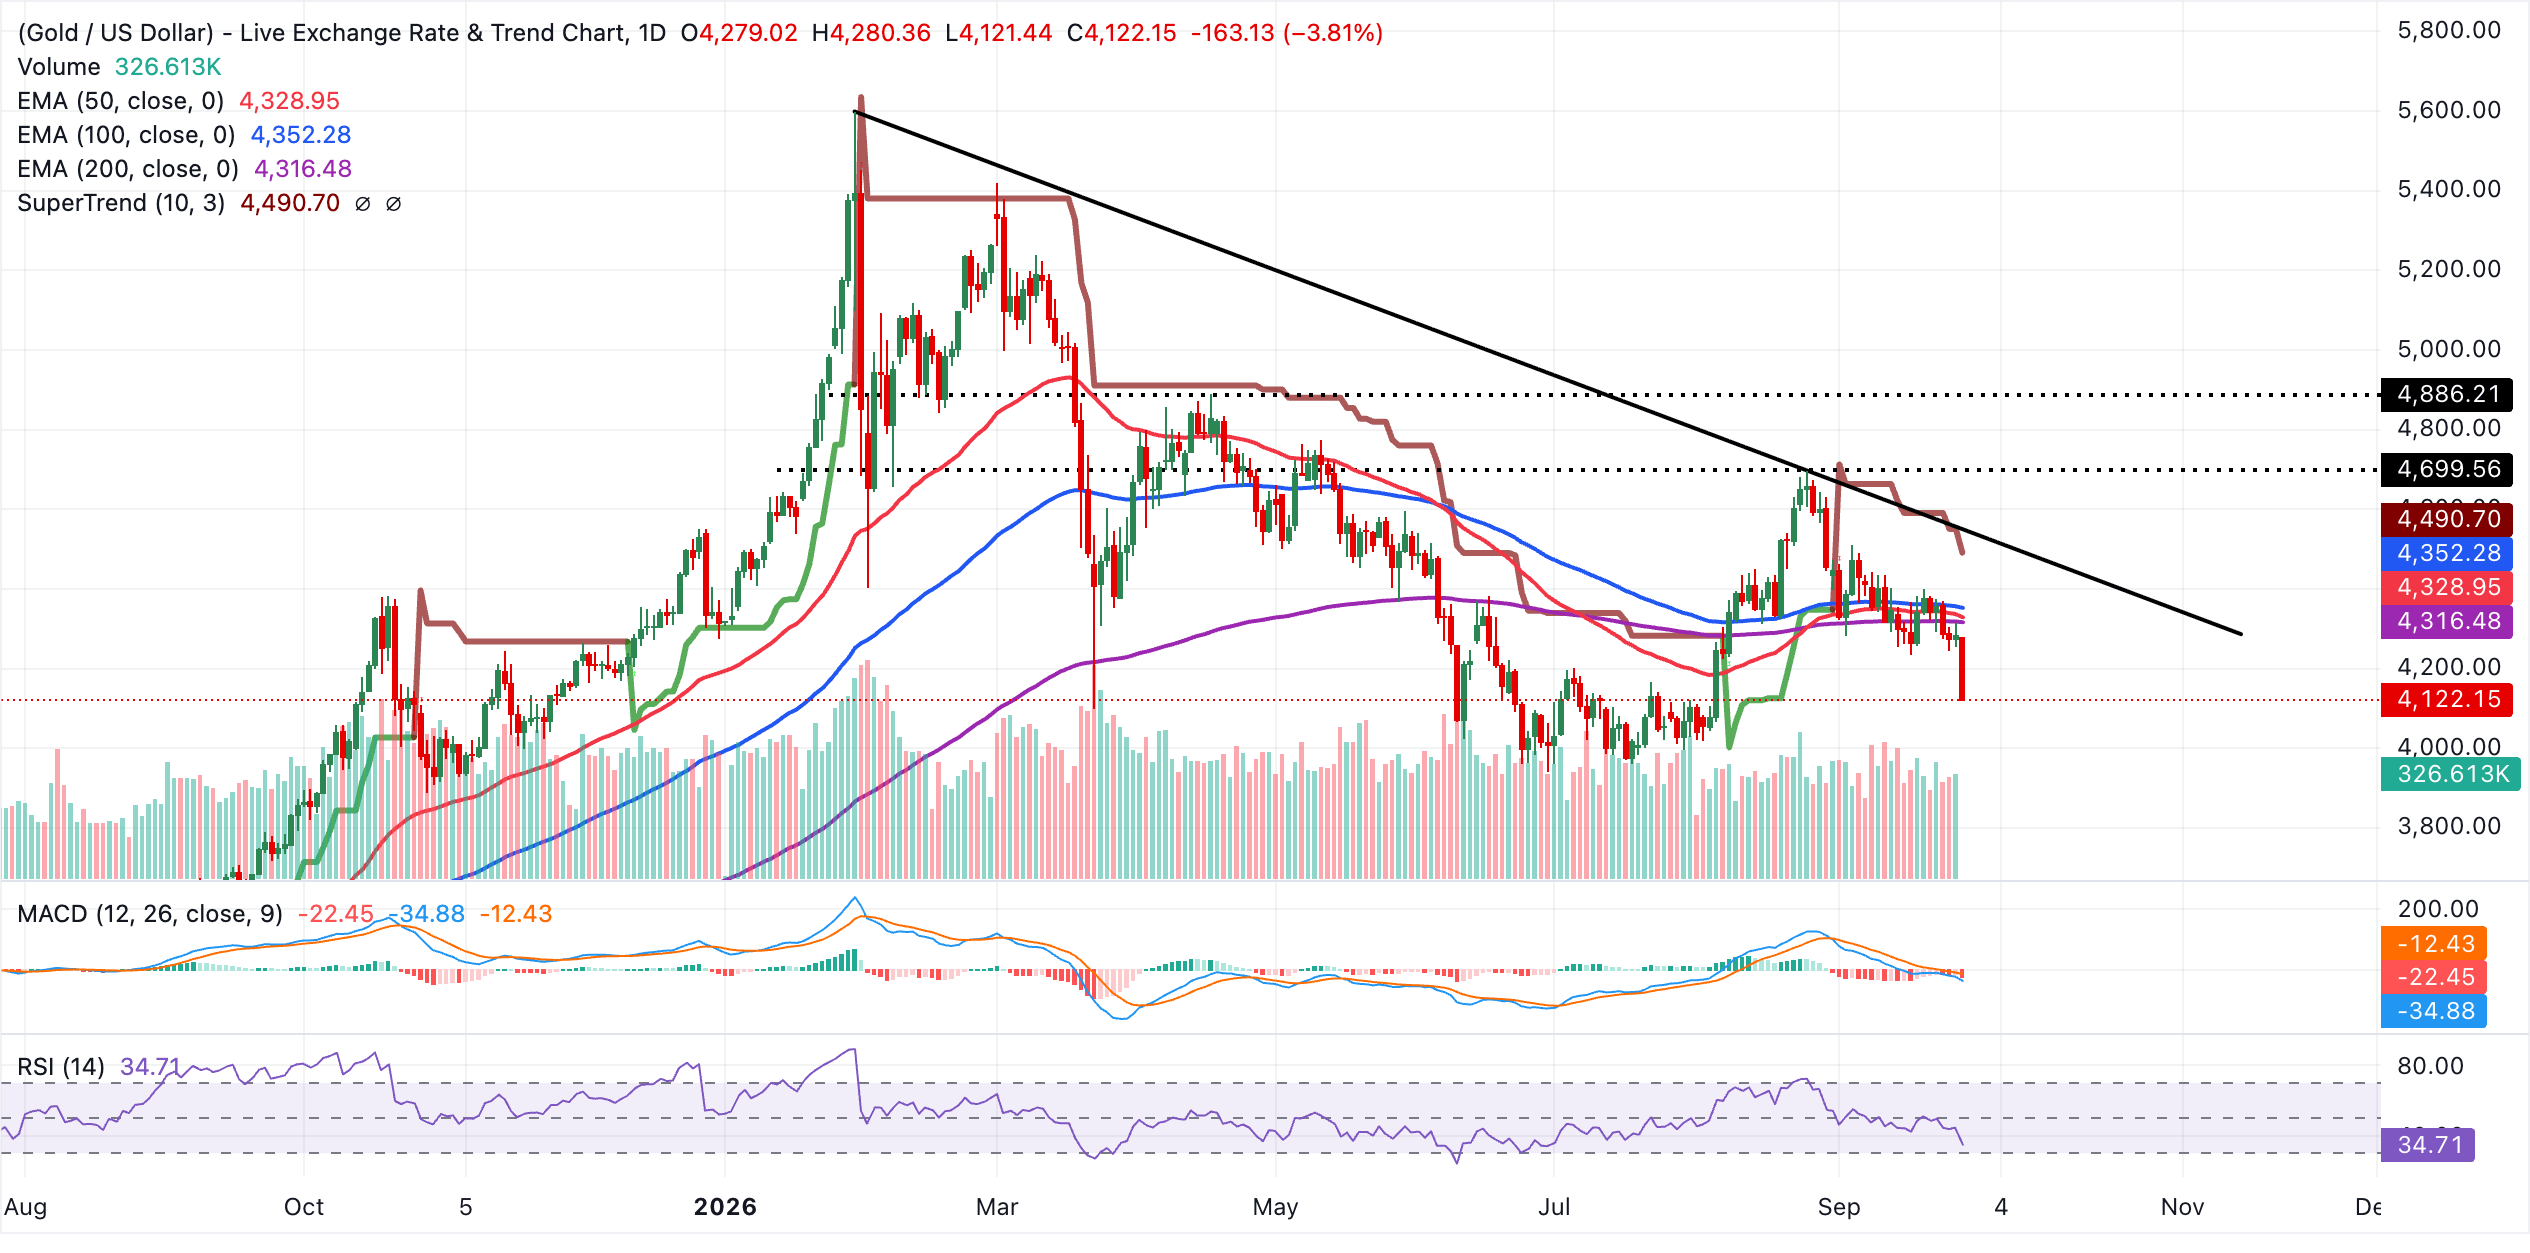
Initial resistance emerges at the 200-day EMA around $4,316, followed by the 50-day EMA at $4,329 and the 100-day EMA near $4,352, forming a dense cap just above the current price that Gold would need to reclaim to ease the bearish tone. Higher up, the trendline break level at $4,482 and the SuperTrend barrier at $4,491 constitute the next resistance cluster where any stronger recovery is likely to stall unless momentum improves markedly. With no technical support levels on the daily chart, the metal remains vulnerable to further downside until fresh demand emerges at key psychological levels, including $4,100 and $4,000.
(The technical analysis of this story was written with the help of an AI tool. Know more.)
Bitcoin, altcoins, stablecoins FAQs
Bitcoin is the largest cryptocurrency by market capitalization, a virtual currency designed to serve as money. This form of payment cannot be controlled by any one person, group, or entity, which eliminates the need for third-party participation during financial transactions.
Altcoins are any cryptocurrency apart from Bitcoin, but some also regard Ethereum as a non-altcoin because it is from these two cryptocurrencies that forking happens. If this is true, then Litecoin is the first altcoin, forked from the Bitcoin protocol and, therefore, an “improved” version of it.
Stablecoins are cryptocurrencies designed to have a stable price, with their value backed by a reserve of the asset it represents. To achieve this, the value of any one stablecoin is pegged to a commodity or financial instrument, such as the US Dollar (USD), with its supply regulated by an algorithm or demand. The main goal of stablecoins is to provide an on/off-ramp for investors willing to trade and invest in cryptocurrencies. Stablecoins also allow investors to store value since cryptocurrencies, in general, are subject to volatility.
Bitcoin dominance is the ratio of Bitcoin's market capitalization to the total market capitalization of all cryptocurrencies combined. It provides a clear picture of Bitcoin’s interest among investors. A high BTC dominance typically happens before and during a bull run, in which investors resort to investing in relatively stable and high market capitalization cryptocurrency like Bitcoin. A drop in BTC dominance usually means that investors are moving their capital and/or profits to altcoins in a quest for higher returns, which usually triggers an explosion of altcoin rallies.
Author

John Isige
FXStreet
John Isige is a seasoned cryptocurrency journalist and markets analyst committed to delivering high-quality, actionable insights tailored to traders, investors, and crypto enthusiasts. He enjoys deep dives into emerging Web3 tren




