Bitcoin tumbles with risk assets as Trump’s Iran stance revives Oil and yield fears
- BTC falls over 3% to 66.5k.
- Trump warned that Iran would be attacked very hard over 2-3 weeks.
- Oil and inflationary fears rise, stocks fall.
- BTC’s recent resilience is being tested.
- BTC technical analysis.

Bitcoin is tumbling on Thursday alongside broader risk assets after President Trump’s overnight address signalled a harder line on Iran and renewed fears of a prolonged conflict. Bitcoin is down almost 3% to around $66.5K.
Middle East headlines push Oil higher
In his address, Trump said he expects the conflict with Iran to be over within the next two to three weeks. However, he also warned that US strikes would intensify in the near term, dampening hopes of any imminent de-escalation.
Markets focused less on the timeline and more on the escalation risk. Following Trump’s comments, oil jumped more than 5% to $106 per barrel. The move higher in oil, combined with no clear path to reopening the Strait of Hormuz, has reignited inflation concerns.
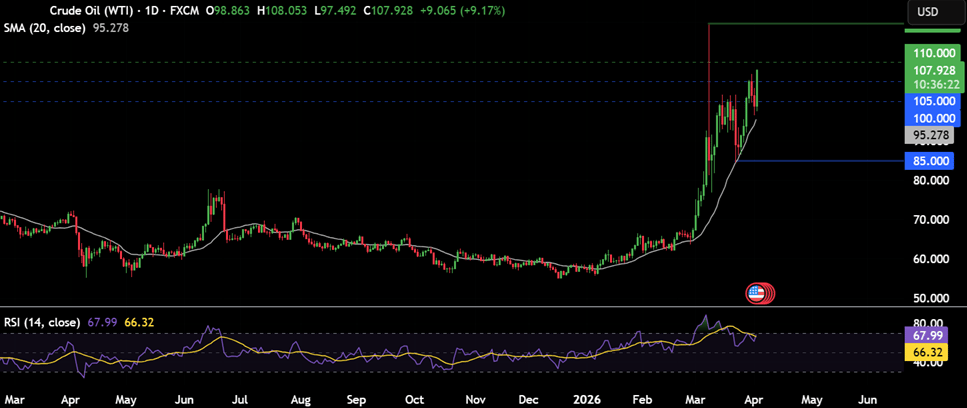
Oil, yields and liquidity are driving BTC
That matters for Bitcoin because the market is increasingly trading through a macro lens.
Rising oil prices feed into inflation expectations, which in turn push Treasury yields higher as investors reassess the path for Federal Reserve policy. The 10-year US Treasury yield has risen back to 4.37%, reflecting concerns that the Fed may need to keep interest rates elevated for longer.
Higher yields tighten financial conditions, strengthen the US dollar, and reduce the appeal of non-yielding assets such as Bitcoin and gold. In other words, the current setup is a headwind for crypto not because of anything crypto-specific, but because the broader macro backdrop is becoming less supportive.
That is also showing up in traditional markets. Nasdaq futures are pointing to a 1.5% lower open, underlining that Bitcoin is once again moving in line with broader risk sentiment rather than independently of it.
Bitcoin’s resilience is being tested
Trump’s latest comments have reversed some of the more positive sentiment that had helped equities, Gold and Bitcoin recover earlier in the week.
Even so, Bitcoin has still been more resilient than many traditional assets recently. BTC ended March around 2% higher, compared with an 11% decline in gold and an almost 5% drop in the Nasdaq.
However, that relative resilience is now being tested. Bitcoin remains around 45% below its record high of $126,000 reached in October, and there are signs that underlying demand is weakening.
Looking ahead
For now, Bitcoin’s price action continues to reflect the same forces driving traditional markets: oil, yields, liquidity, and geopolitical risk. Unless there is a clearer path to de-escalation in the Middle East — and with it lower oil prices and easing yields — Bitcoin could remain vulnerable to further downside.
BTC technical analysis
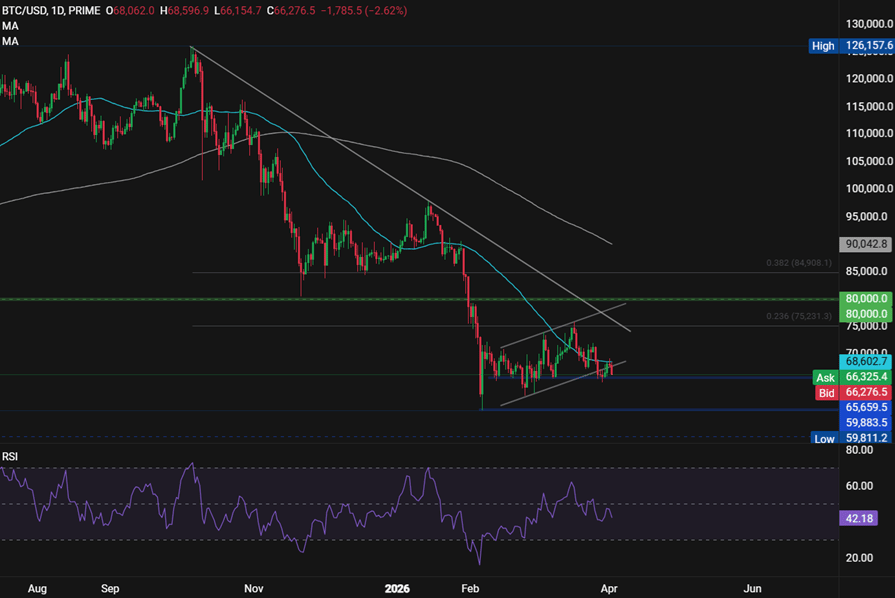
Bitcoin trades in a longer-term downtrend, below its falling trend line dating back to early October and its 200 SMA. The price recovered from the 2026 low of 60k, rising to a March high of 76k in a potential bear flag formation. The price rebounded lower from 76k, breaking below the 50 SMA and the lower band of the channel to 65k support. A recent rejection of the 50 SMA resistance reforms the bearish bias.
Sellers will need to break below 65k to open the door to a deeper selloff towards 60k.
The first test on the upside will be above 69k, the 50 SMA, and the lower band of the rising channel. Above here 76k, the March high and the 23.6% Fib retracement of the 126.6k high and the 60k low as well as the falling trendline.
Start trading with PrimeXBT
Author

PrimeXBT Research Team
PrimeXBT
PrimeXBT is a leading Crypto and CFD broker that offers an all-in-one trading platform to buy, sell and store Cryptocurrencies and trade over 100 popular markets, including Crypto Futures, Copy Trading and CFDs on Crypto, Forex, I