Bitcoin remains under pressure, faces resistance at $45k

After yesterday’s 14% plunge, bitcoin (BTC) clawed back to around $40,000 during Asian hours but remained under pressure.
Sharp price swings have become the norm this week as the broader uptrend weakens similar to 2018, which was the start of a bear market.
-
Bitcoin faces resistance around $45,000, defined by the 50-period volume weighted moving average on the four-hour chart.
-
The relative strength index (RSI) remains oversold on the four-hour chart, although buyers are on the sideline as volatility rises.
-
Bitcoin is stabilizing around the 200-day moving average. A decisive break below $40,000 would signal a trend shift from bullish to bearish.
-
Lower support is seen around $27,000 which is a roughly 60% retracement of the March 2020 low.
-
“$27,000 may be a more realistic gauge of support given the lack of oversold buy signals, which is probably a function of how fast the pullback unfolded,” said Katie Stockton of Fairlead Strategies in an interview with CoinDesk.
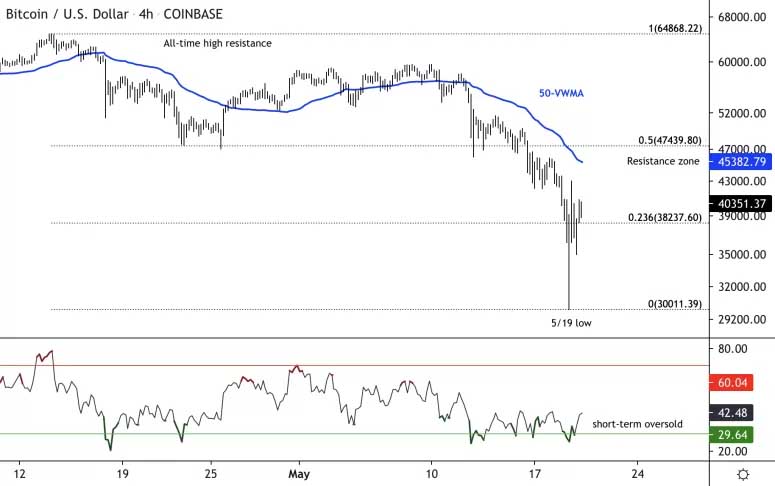
Four-hour bitcoin chart shows support and resistance with oversold RSI.
Source: TradingView
Sharp drawdowns of about 40% are common towards the end of a bull market similar to 2017 and 2018.
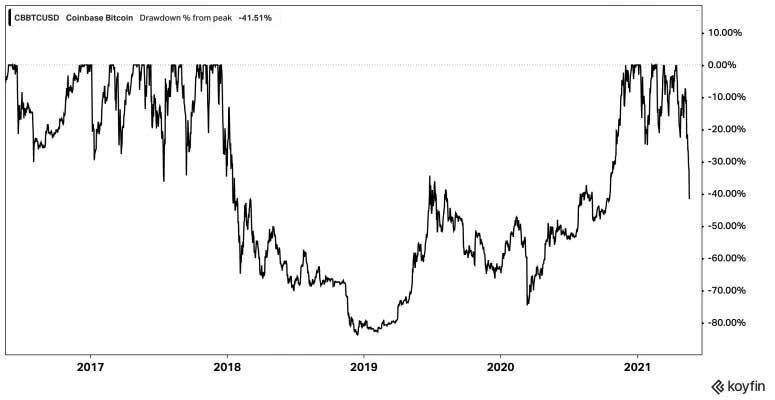
Chart shows the percentage decline in bitcoin from peak to trough.
Source: Koyfin
Author

CoinDesk Analysis Team
CoinDesk
CoinDesk is the media platform for the next generation of investors exploring how cryptocurrencies and digital assets are contributing to the evolution of the global financial system.


