Bitcoin Price Forecast: Reclaims the $99K mark
Bitcoin price today: $99,200
- Bitcoin price extends its recovery on Monday after surging almost 5% in the previous week.
- A 10xResearch report suggests BTC could approach its all-time high of $108,353 ahead of Trump’s inauguration.
- Bitcoin’s institutional demand shows slight signs of recovery after being skewed over the past three weeks.
Bitcoin (BTC) trades in green at around $99,200 on Monday after recovering almost 5% in the previous week. A 10xResearch report suggests BTC could approach its all-time high (ATH) of $108,353 ahead of Trump’s inauguration. Moreover, Bitcoin’s institutional demand showed a slight recovery of a $255.2 million inflow last week after being skewed over the past three weeks, hinting at a rally continuation.
Bitcoin could reclaim its all-time high ahead of Trump’s inauguration
Bitcoin price reclaims the $99K on Monday after recovering almost 5% in the previous week. According to a 10xResearch report highlights Bitcoin’s price action for January.
“While some initial enthusiasm is expected at the start of the New Year, this is not the time for the same level of bullishness we experienced from late January to March 2024 or late September to mid-December,” says 10xResearch analyst.
The report explains that Bitcoin could have a positive start to the year, followed by a slight pullback leading into the US Consumer Price Index (CPI) data release on January 15, as shown in the graph below. A favorable inflation print could reignite optimism, fueling a rally into Donald Trump’s Presidential inauguration on January 20. However, this momentum may wane, with the market likely retreating somewhat ahead of the FOMC meeting on January 29.
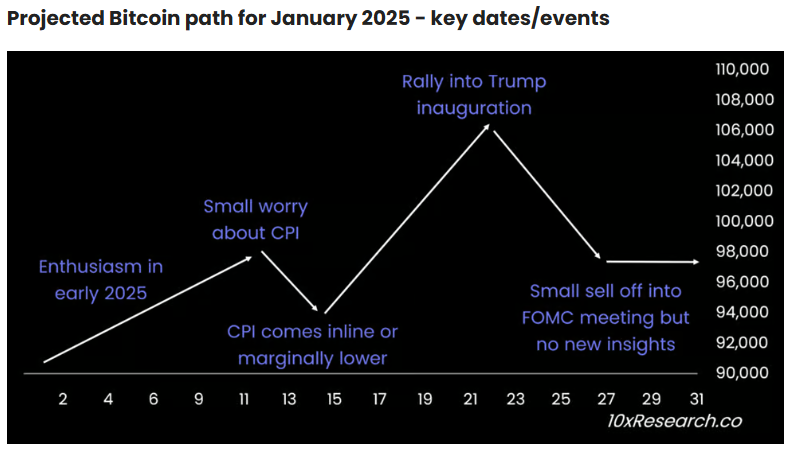
Projected Bitcoin path for January 2025. Source: 10xResearch
The report further explains that trading volumes have significantly declined, returning to levels before the US presidential election. Binance’s spot volume has dropped to $12 billion, down sharply from its peak of $65 billion.
Another metric to watch for is total inflows. According to 10xResearch, $129 billion in total inflows were recorded over the past year, with $62 billion from stablecoins, $35 billion from Bitcoin Exchange Traded Funds (ETFs), and $32 billion from increased perpetual futures leverage. As traders return from the holiday season, monitoring the evolution of these inflows will be critical.
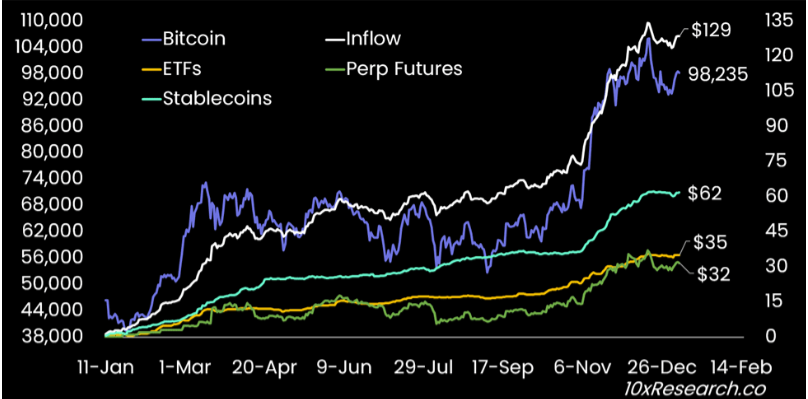
Bitcoin (LHS) vs. Money Flow indicators chart. Source: 10xResearch
Looking down on institutional demand shows a slight sign of recovery after being skewed over the past three weeks, likely due to the holiday season. According to Coinglass, Bitcoin Spot ETFs data recorded a total net inflow of $255.2 million last week, after a $377.6 million outflow the previous week. However, as traders and investors return, these dynamics could shift significantly, leading to a stronger magnitude of inflows, as seen in early December.
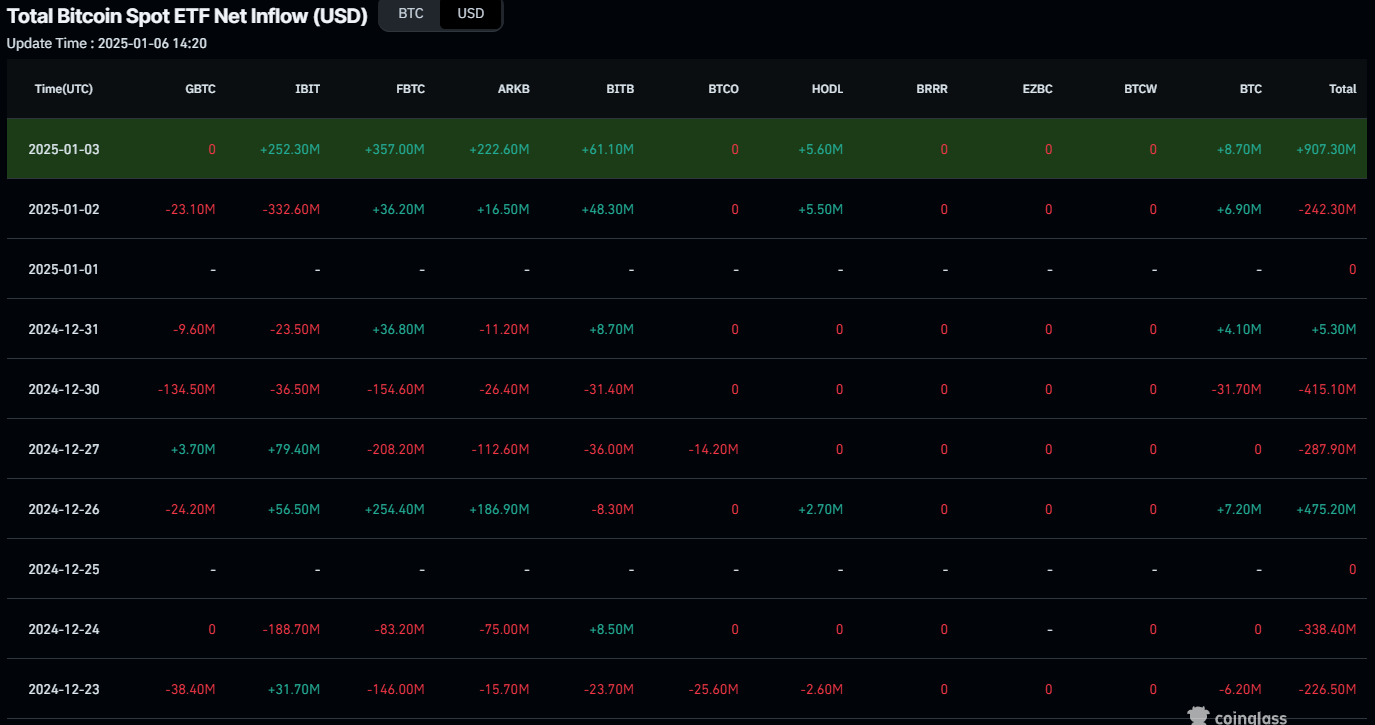
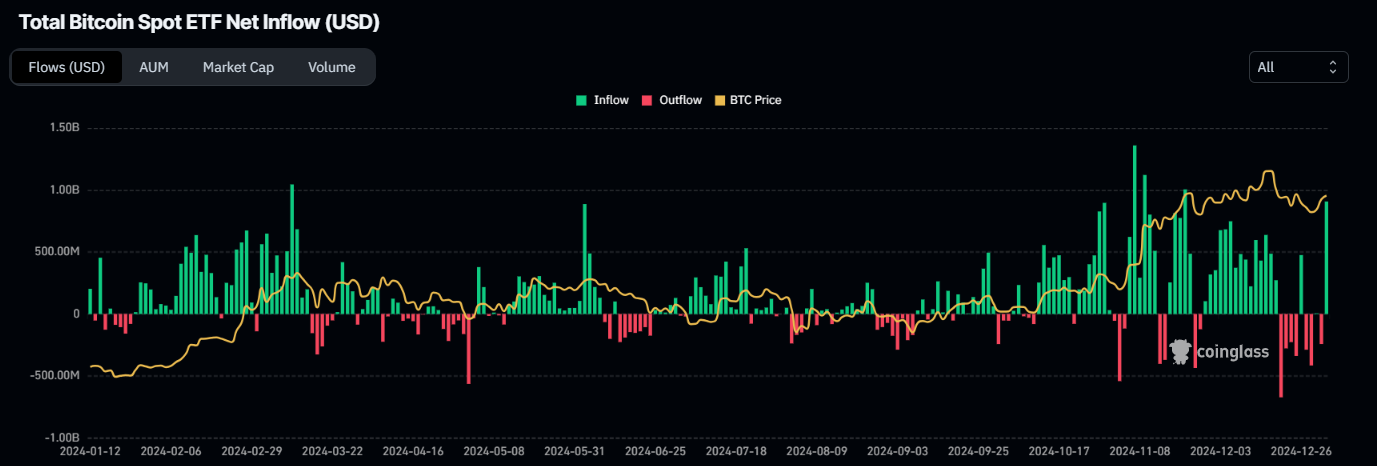
Total Bitcoin Spot ETF Net Inflow chart. Source: Coinglass
Bitcoin Price Forecast: BTC recovers and claims $99K mark
Bitcoin price found support around the 38.2% Fibonacci retracement level, drawn from the November 4 low of $66,835 to the December 17 high of $108,353, at $92,493 on December 30, 2024, and rose 6% in the next six days. This level roughly coincides with the 50-day Exponential Moving Average (EMA) at $94,182, making it a key zone. At the time of writing on Monday, BTC trades at around $99,200.
If BTC continues the upward momentum, it could extend its rally to retest its key psychological importance level of $100,000. A successful close above that level would extend an additional rally to retest its December 17, 2024, all-time high of $108,353.
The Relative Strength Index (RSI) on the daily chart reads 56, above its neutral value of 50, and it is pointing upwards, suggesting bullish momentum is gaining traction. Additionally, the Moving Average Convergence Divergence (MACD) indicator on the daily chart flipped a bullish crossover on Sunday, signaling a buy signal and continuation of an uptrend.
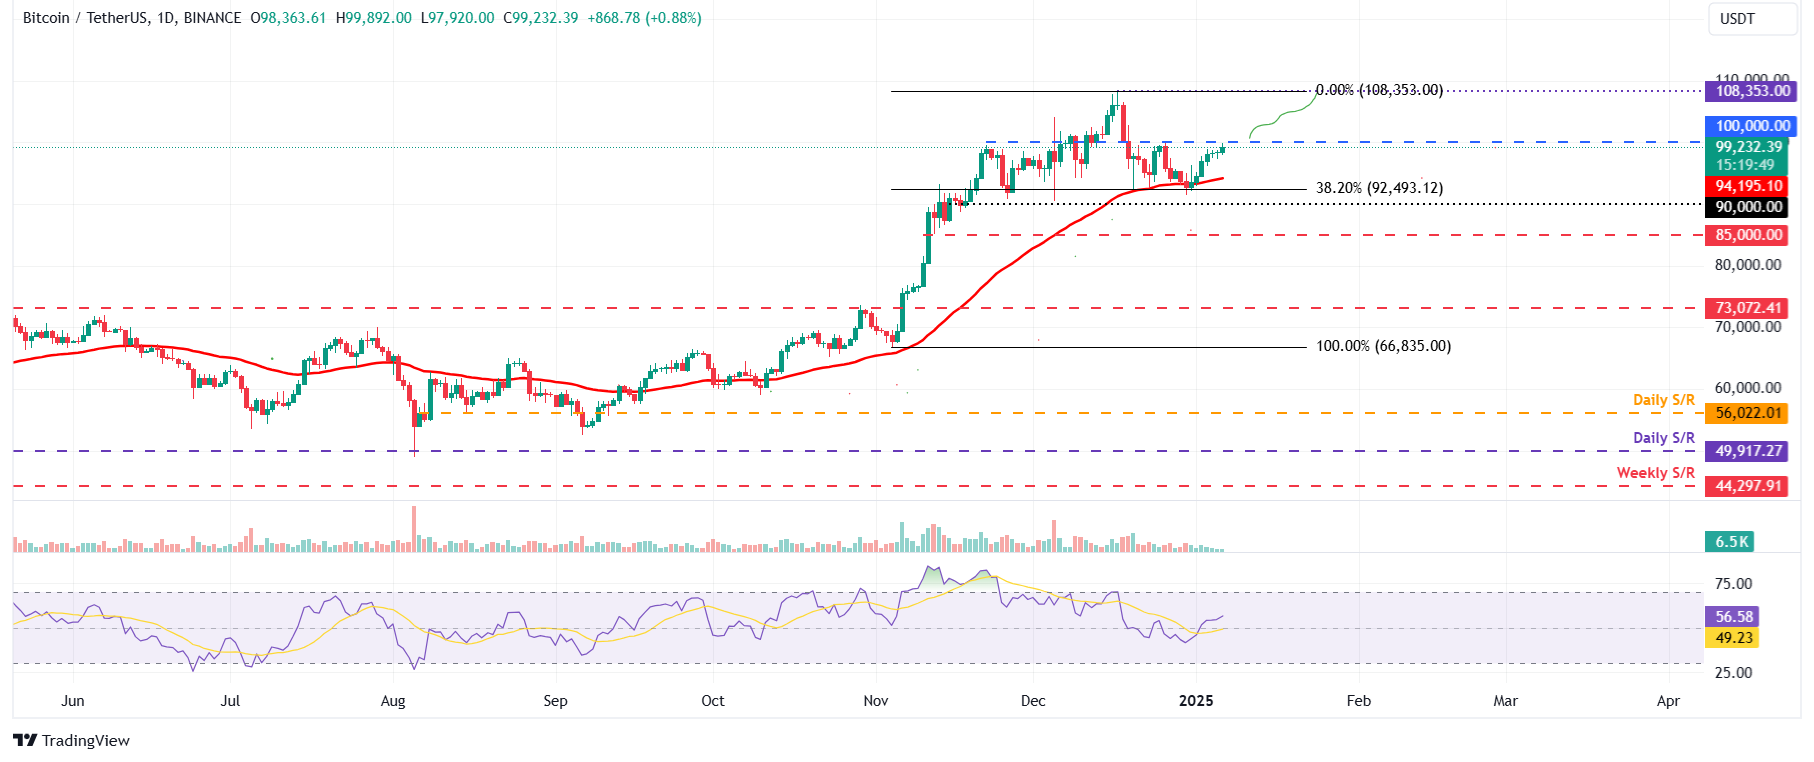
BTC/USDT daily chart
However, if BTC closes below the $92,493 level, it would extend the decline to retest its key support level at $90,000.
Bitcoin, altcoins, stablecoins FAQs
Bitcoin is the largest cryptocurrency by market capitalization, a virtual currency designed to serve as money. This form of payment cannot be controlled by any one person, group, or entity, which eliminates the need for third-party participation during financial transactions.
Altcoins are any cryptocurrency apart from Bitcoin, but some also regard Ethereum as a non-altcoin because it is from these two cryptocurrencies that forking happens. If this is true, then Litecoin is the first altcoin, forked from the Bitcoin protocol and, therefore, an “improved” version of it.
Stablecoins are cryptocurrencies designed to have a stable price, with their value backed by a reserve of the asset it represents. To achieve this, the value of any one stablecoin is pegged to a commodity or financial instrument, such as the US Dollar (USD), with its supply regulated by an algorithm or demand. The main goal of stablecoins is to provide an on/off-ramp for investors willing to trade and invest in cryptocurrencies. Stablecoins also allow investors to store value since cryptocurrencies, in general, are subject to volatility.
Bitcoin dominance is the ratio of Bitcoin's market capitalization to the total market capitalization of all cryptocurrencies combined. It provides a clear picture of Bitcoin’s interest among investors. A high BTC dominance typically happens before and during a bull run, in which investors resort to investing in relatively stable and high market capitalization cryptocurrency like Bitcoin. A drop in BTC dominance usually means that investors are moving their capital and/or profits to altcoins in a quest for higher returns, which usually triggers an explosion of altcoin rallies.
Author

Manish Chhetri
FXStreet
Manish Chhetri is a crypto specialist with over four years of experience in the cryptocurrency industry.


