Bitcoin Price Forecast: Analysts anticipate increased volatility as the US presidential election looms

Bitcoin price today: $68,600
- Bitcoin price teased its all-time high of $73,777 last week but declined to trade below $69,000 on Monday.
- Analysts suggest that market volatility is expected to rise as the US presidential election approaches.
- The upcoming elections would trigger another “sell-the-news” reaction, similar to what was observed at the Nashville Bitcoin conference.
Bitcoin (BTC) continues to trade in the red on Monday after being rejected near its all-time high of $73,777 last week. Analysts suggest that the upcoming US presidential election on Tuesday will likely increase market volatility. Some expect it will trigger another “sell-the-news” reaction like that seen during the Nashville Bitcoin conference, prompting traders to remain cautious amidst the anticipated fluctuations.
US presidential elections are likely to increase Bitcoin volatility
As the US presidential election approaches, market volatility is expected to rise. Due to its pro-crypto stance, the crypto community slightly prefers former President Donald Trump winning the election, adding complexity to market predictions.
Analysis of on-chain metrics provides insights into Bitcoin’s movements, with Santiment’s social volume data indicating that spikes in mentions of political candidates often correlate with market rallies. Notably, Trump tends to dominate social media discussions, which could influence crypto prices as the election approaches. The Santiment social trends tool shows that his mentions frequently outpace those of Vice President and Democrat candidate Kamala Harris, suggesting a link between his media presence and market activity.
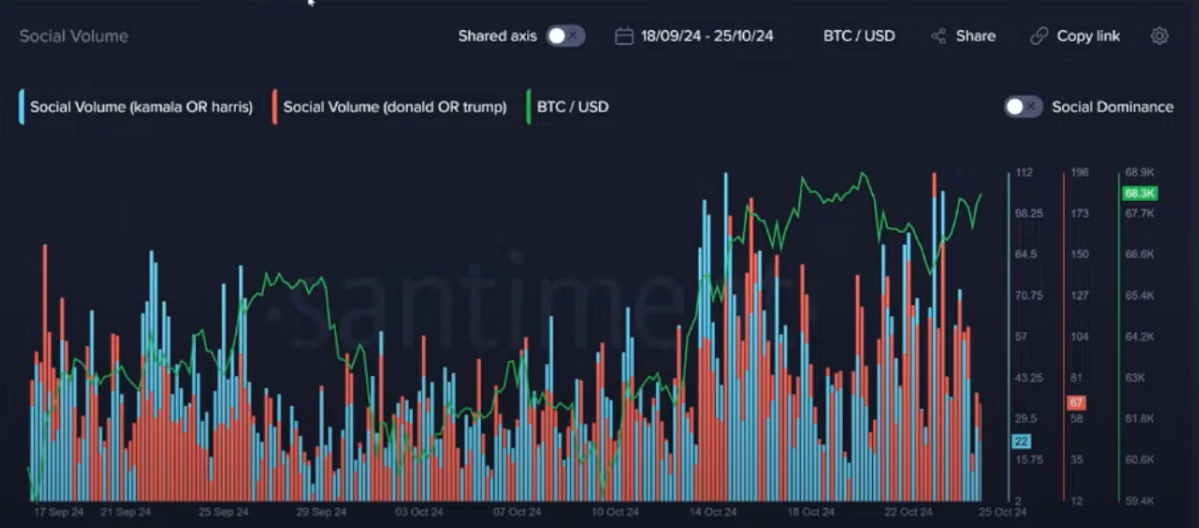
Bitcoin Social Volume chart. Source: Santiment
With the US set to announce the election results this week, crypto traders are “expecting the unexpected,” especially Bitcoin whales, as shown in the graph below.
BTC whales have shown declining transfer volumes since last week, with a sudden spike near the peak price of $73,620 on October 29. These fluctuations in whale BTC transactions are generally reliable indicators of potential price reversals across the cryptocurrency market. It’s important to note that whale passivity doesn’t necessarily mean prices will drop. This common misconception overlooks that it often signals their anticipation of the crowd’s reaction to events and the volatility generated by smaller traders before they decide to re-enter the market.
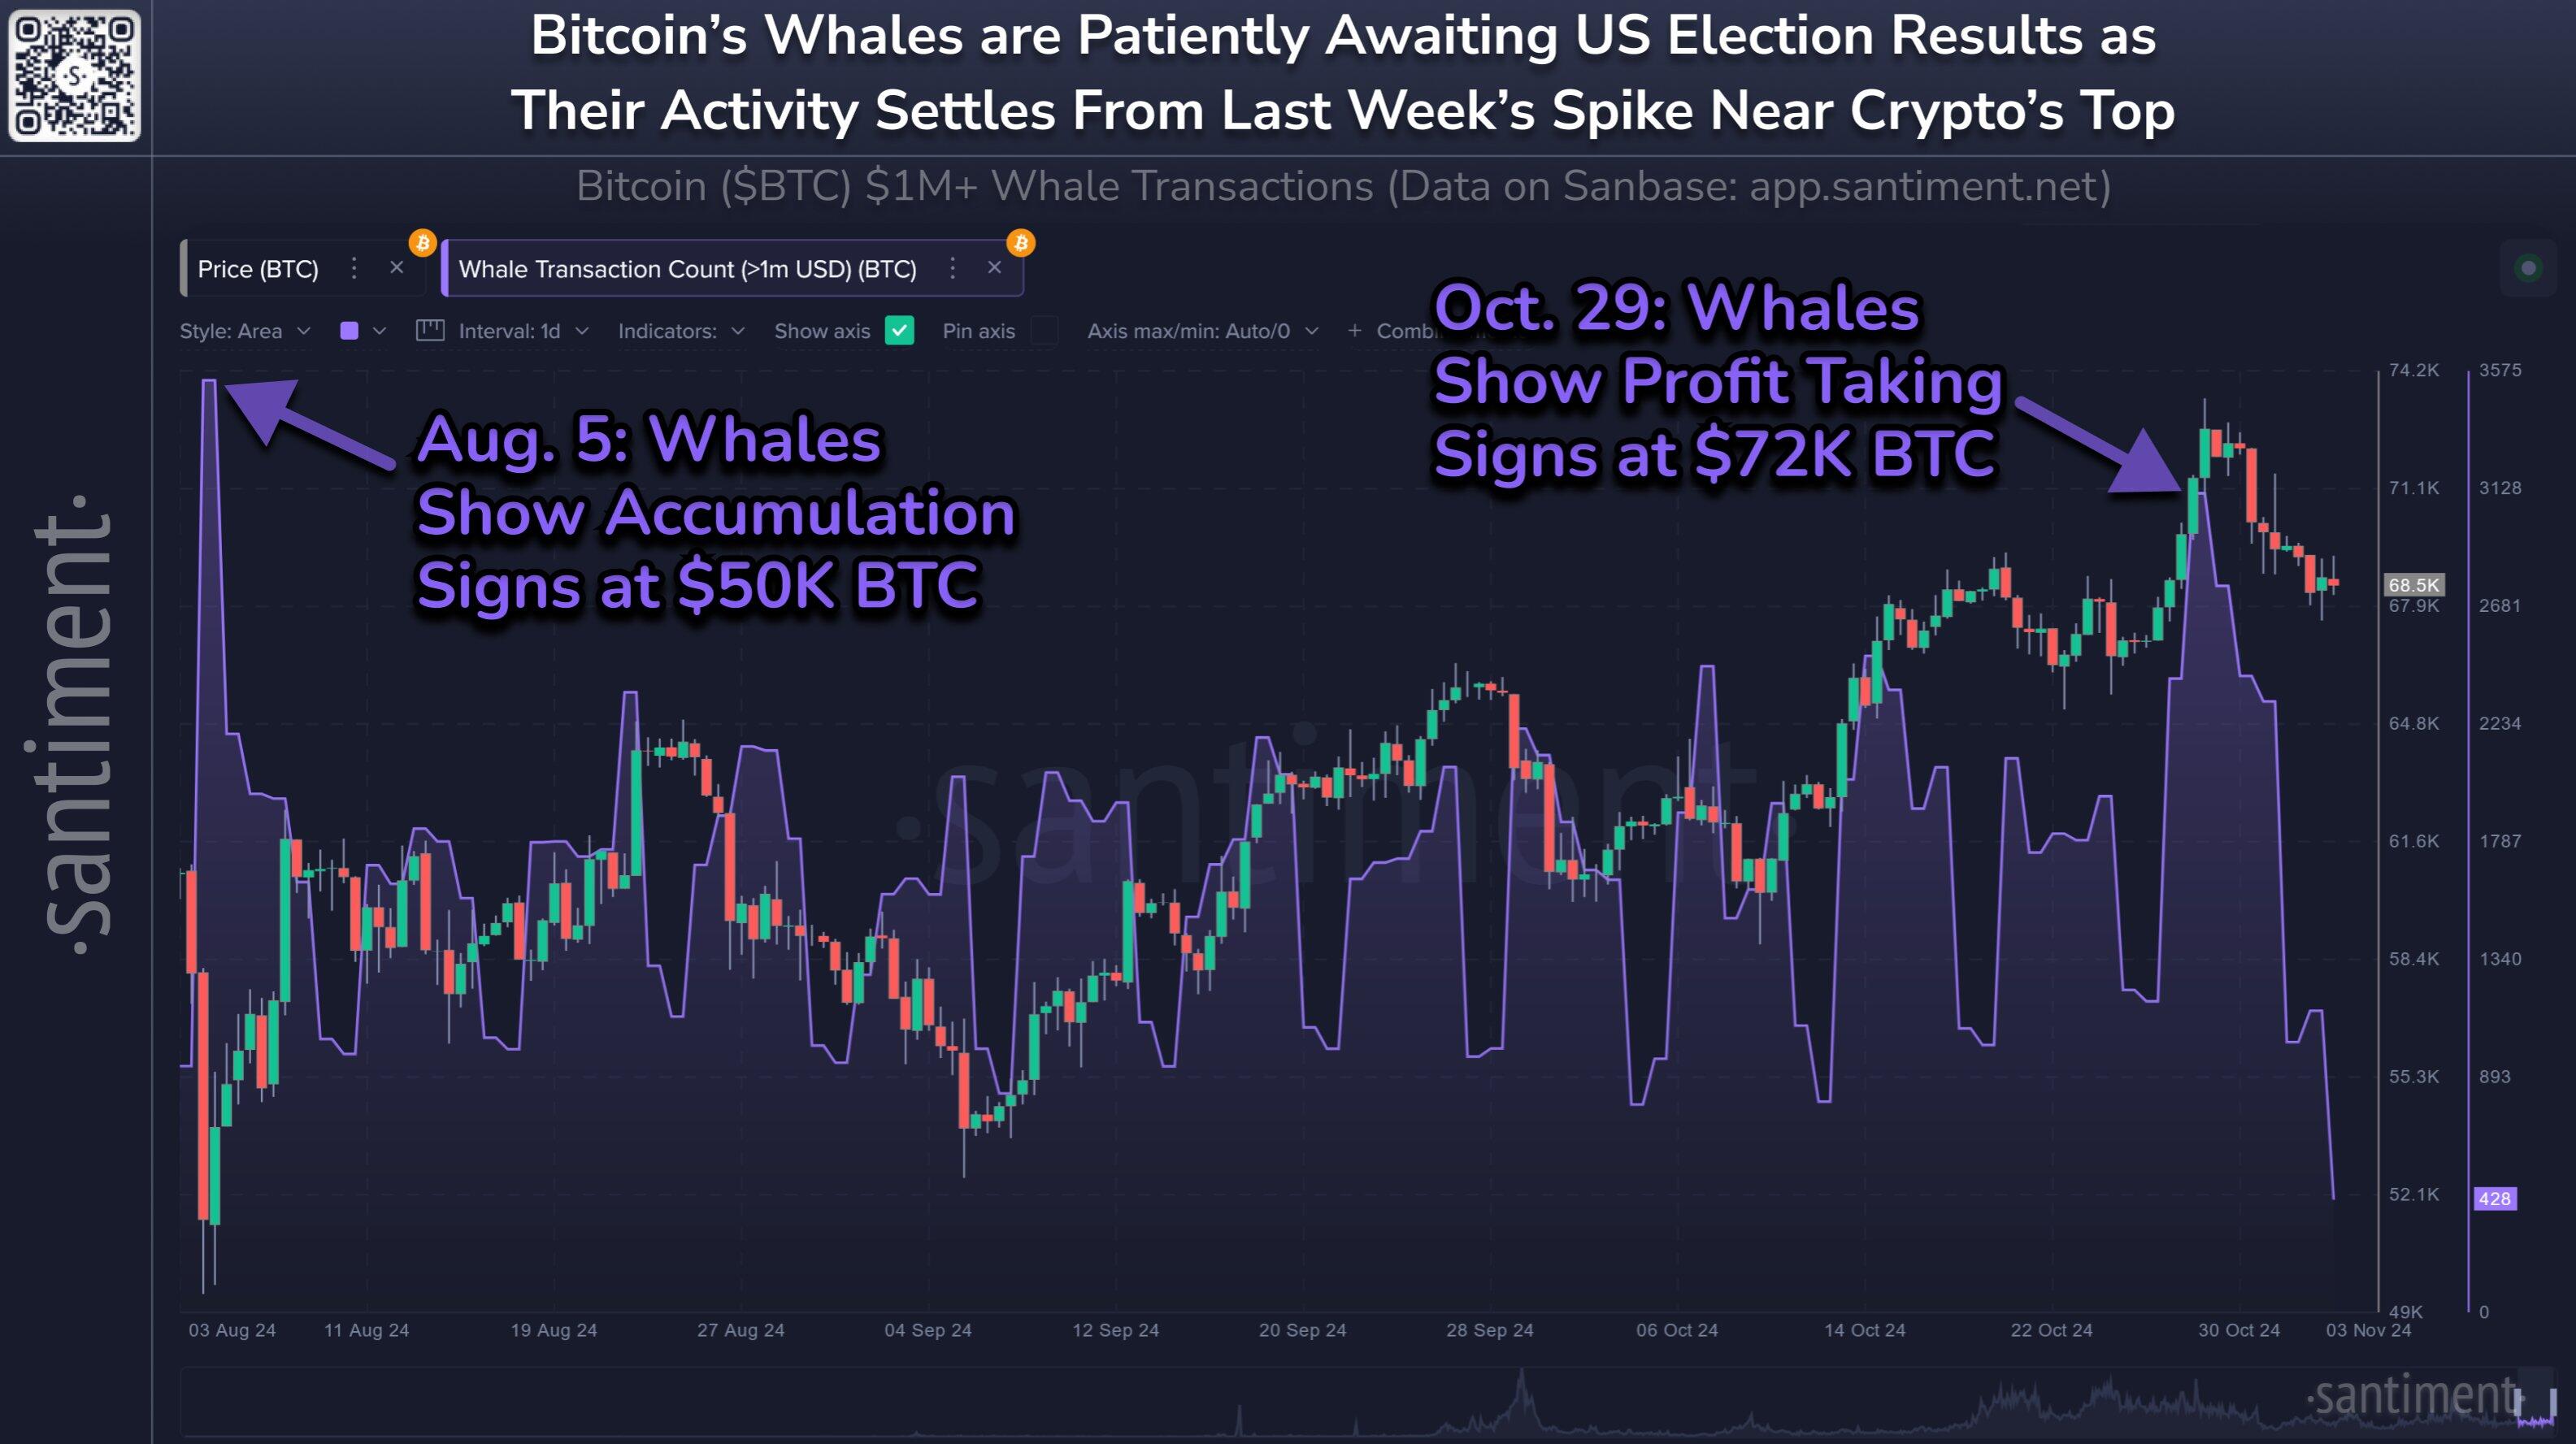
Bitcoin whale activity chart. Source: Santiment
QCP’s capital weekly report also highlights that the presidential election will be another sell-the-news action. “While Trump has been favored as the next POTUS, bets on Trump have come off significantly from a 66% high on Polymarket to 57% for Trump and 43% for Harris. Regardless of the outcome, we believe the Elections will be another sell-the-news action, replicating the Nashville Bitcoin conference.” the report says.
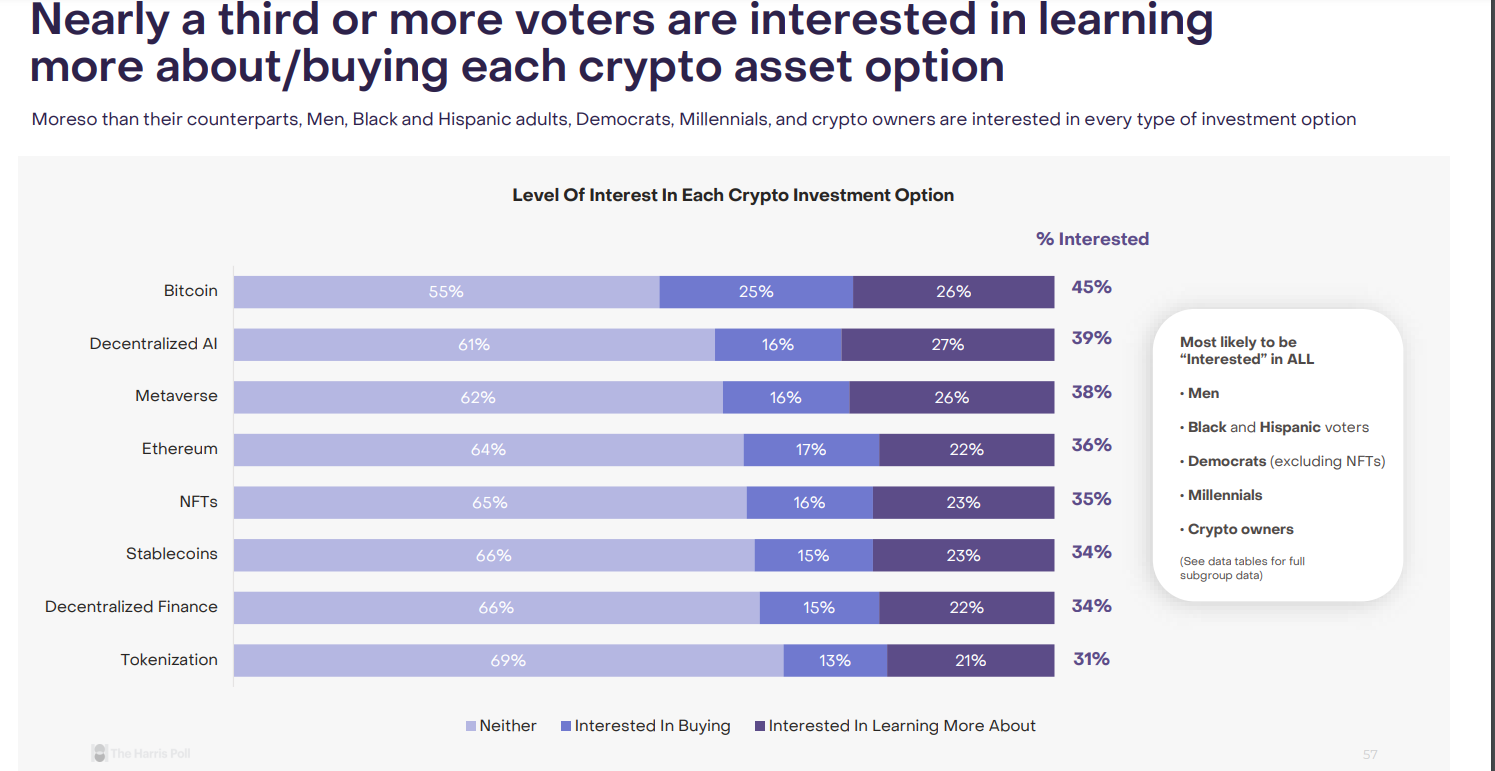
Lastly, this US election is more likely to impact crypto markets than others before it. According to a Grayscale report, nearly a third or more voters are interested in learning more about/buying each crypto asset option.
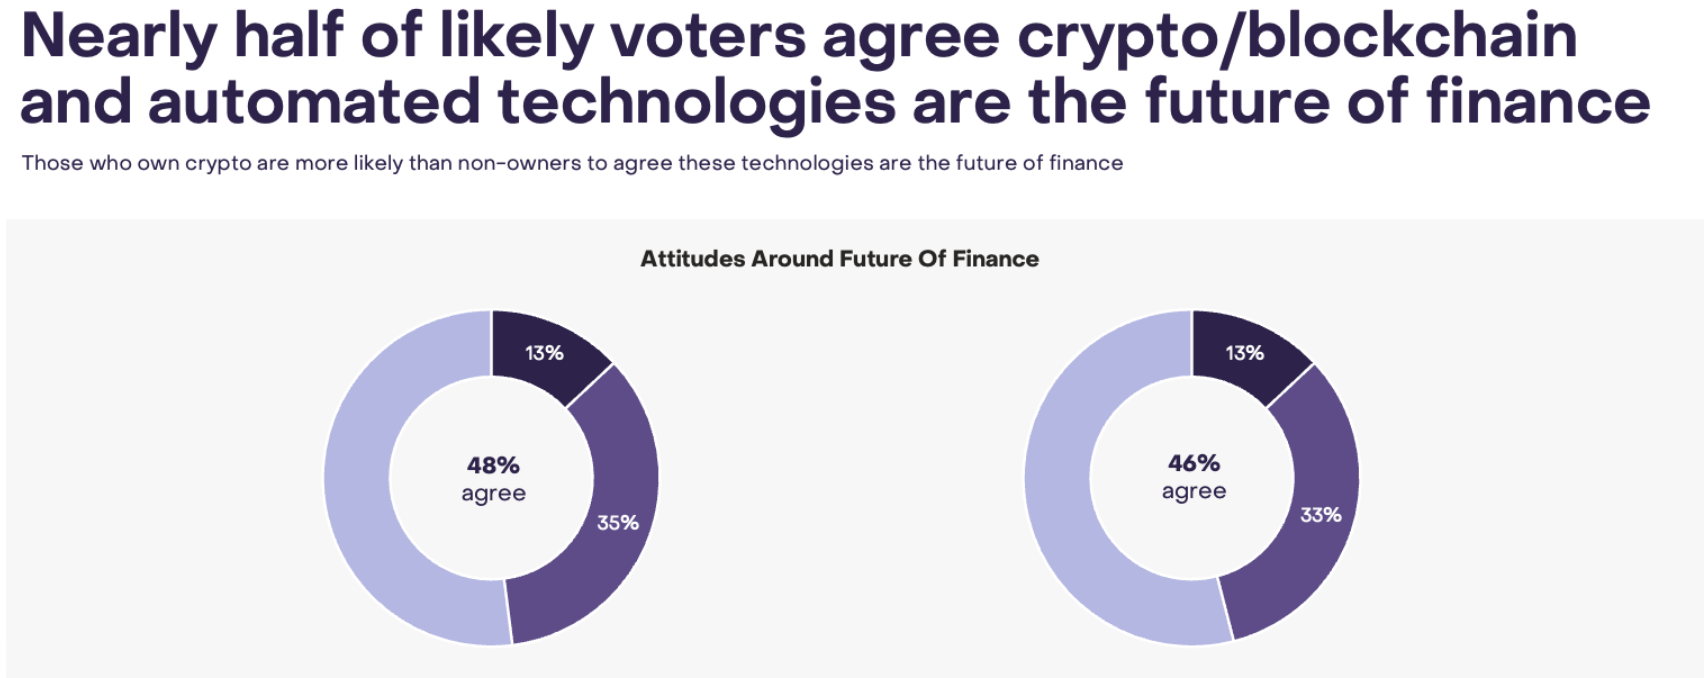
Additionally, the report shows that nearly half of likely voters agree crypto/blockchain and automated technologies are the future of finance.
Bitcoin Price Forecast: Technical indicators show signs of weakness
Bitcoin price faced rejection around its all-time high (ATH) of $73,777 on October 29 and declined 5.44% in the next five days, closing below the $69,519 key level on Friday. At the time of writing on Monday, it continues to trade slightly down, around $68,600.
If BTC continues to decline, it could decline to retest its key psychologically important level of $66,000.
The Moving Average Convergence Divergence (MACD) indicator further supports Bitcoin’s decline, signaling a bearish crossover on Sunday’s daily chart. The MACD line (blue line) moved below the signal line (yellow line), giving a sell signal. This indicator shows rising red histogram bars below the neutral line zero, also suggesting that Bitcoin’s price could experience downward momentum.
Additionally, the Relative Strength Index (RSI) on the daily chart is currently at 54 and trending downwards, nearing its neutral level of 50. A daily close below this neutral level would suggest increasing bearish momentum and could significantly weigh on Bitcoin price.
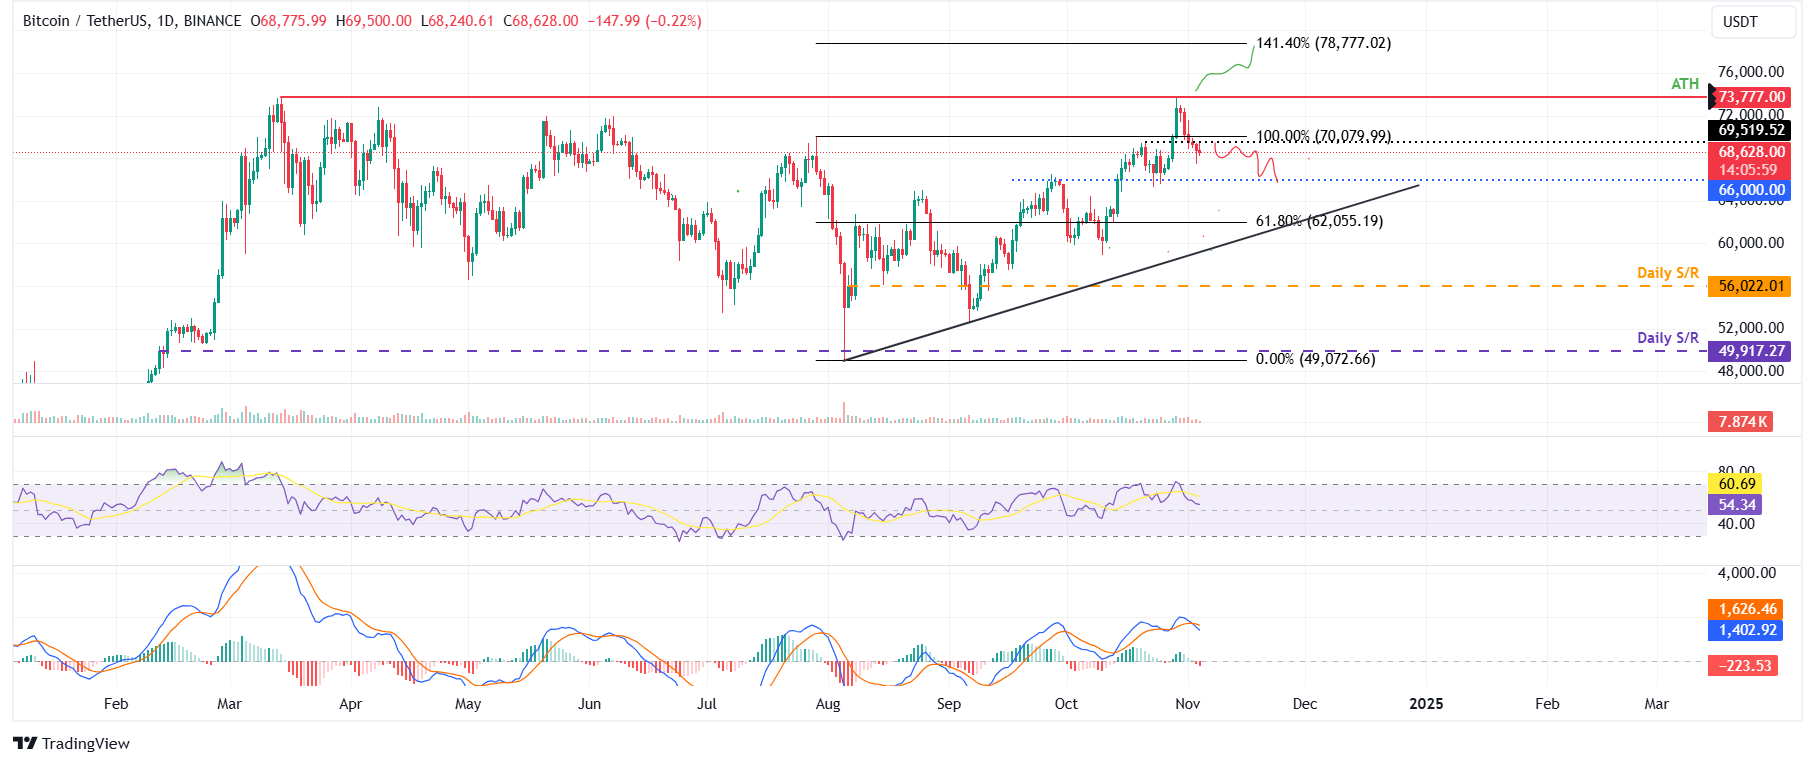
BTC/USDT daily chart
Conversely, if BTC breaks and closes above the $69,519 level (October 21 high), it could rise to retest its ATH at $73,777.
Bitcoin, altcoins, stablecoins FAQs
Bitcoin is the largest cryptocurrency by market capitalization, a virtual currency designed to serve as money. This form of payment cannot be controlled by any one person, group, or entity, which eliminates the need for third-party participation during financial transactions.
Altcoins are any cryptocurrency apart from Bitcoin, but some also regard Ethereum as a non-altcoin because it is from these two cryptocurrencies that forking happens. If this is true, then Litecoin is the first altcoin, forked from the Bitcoin protocol and, therefore, an “improved” version of it.
Stablecoins are cryptocurrencies designed to have a stable price, with their value backed by a reserve of the asset it represents. To achieve this, the value of any one stablecoin is pegged to a commodity or financial instrument, such as the US Dollar (USD), with its supply regulated by an algorithm or demand. The main goal of stablecoins is to provide an on/off-ramp for investors willing to trade and invest in cryptocurrencies. Stablecoins also allow investors to store value since cryptocurrencies, in general, are subject to volatility.
Bitcoin dominance is the ratio of Bitcoin's market capitalization to the total market capitalization of all cryptocurrencies combined. It provides a clear picture of Bitcoin’s interest among investors. A high BTC dominance typically happens before and during a bull run, in which investors resort to investing in relatively stable and high market capitalization cryptocurrency like Bitcoin. A drop in BTC dominance usually means that investors are moving their capital and/or profits to altcoins in a quest for higher returns, which usually triggers an explosion of altcoin rallies.
Author

Manish Chhetri
FXStreet
Manish Chhetri is a crypto specialist with over four years of experience in the cryptocurrency industry.


