Bitcoin price analysis: BTC/USD makes a breakout of bullish pennant pattern; $8,500 resistance is a very key area to be tested
- Bitcoin has broken out of a bullish pennant formation, now set to test key resistance at $8,500.
- BTC/USD has jumped 25% since last Wednesday, on 11th April, moving from the mid $6,000 region.

The Bitcoin price is seen up with a modest 0.5% of gains on Friday, after the previous session saw BTC/USD making a break and close above the bullish pennant pattern, as seen on the daily time frame, indicating further upside ahead.
Since the change in short-term trend which triggered last Wednesday, 11th April, BTC/USD has gained around 25%, with a big push from the mid $6,000 region. Across the crypto market, gains have been enjoyed by the major altcoins, but it is still early to say if the longer-term trend is out of the bearish state.
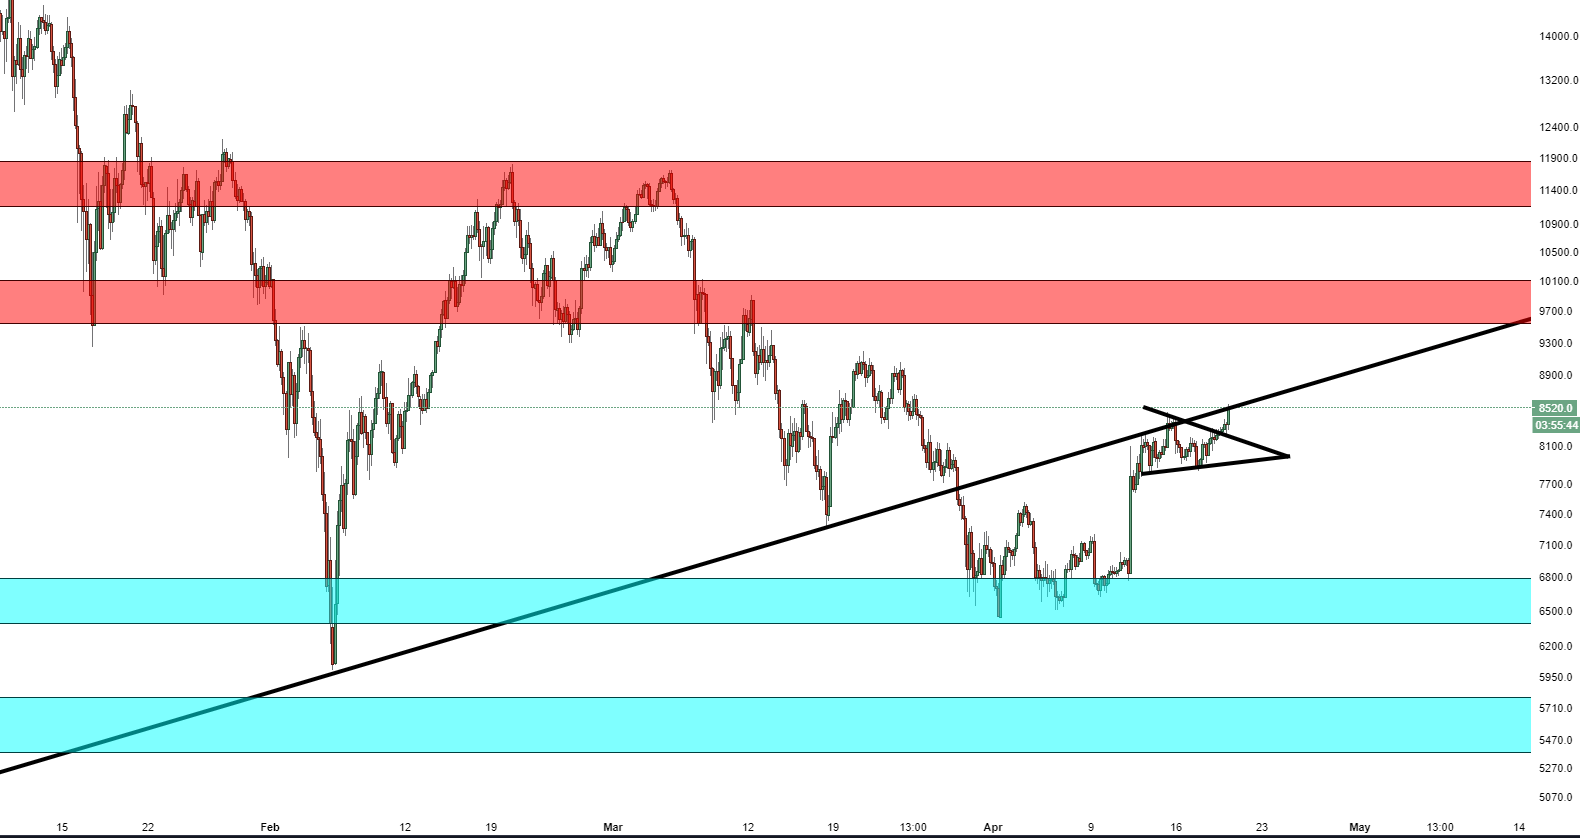
BTC/USD is gunning for a strong resistance level, which is seen at $8,500, a push through would mean the bulls have managed to be back above a long-running ascending trend line, from September 2017. Should $8,500 be taken out, a move up to $9,000-9,500 will be possibly, ahead of the psychological $10,000 mark.
BTC/USD daily chart
Author

Ken Chigbo
Independent Analyst
Ken has over 8 years exposure to the financial markets. He started his career as an analyst, covering a variety of asset classes; forex, fixed income, commodities and equities.


