|

Bitcoin (BTC/USD) looking to extend higher [Video]

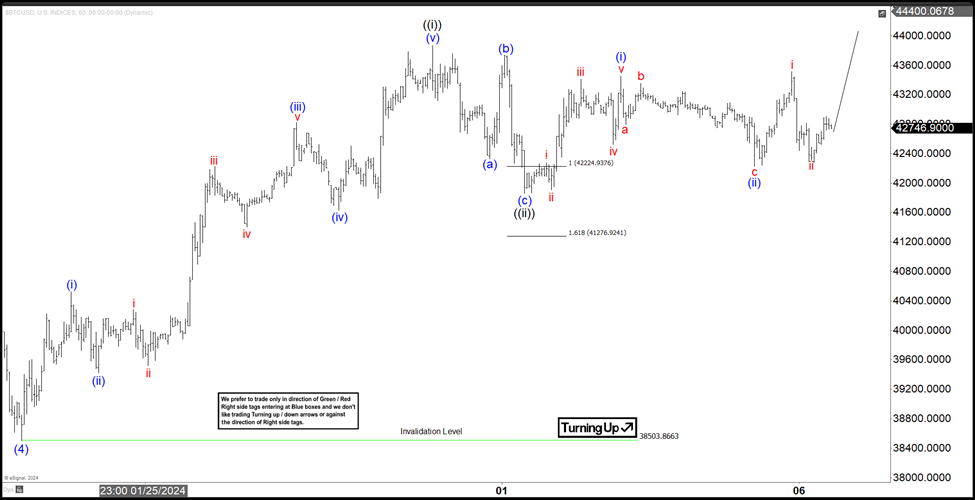
Short Term Elliott Wave view in Bitcoin (BTCUSD) suggests the rally to 49500 on January 11, 2024 ended wave (3). Pullback in wave (4) is proposed complete at 38503.8 as the 1 hour chart  below shows. Up from wave (4), wave (i) ended at 40526.3 and pullback in wave (ii) ended at 39419.8. The crypto currency then extended rally higher in wave (iii) towards 42823.2 and pullback in wave (iv) ended at 41628.6. Final leg higher wave (v) ended at 43865 which completed wave ((i)) in higher degree. Bitcoin then pullback in wave ((ii)) towards 41856.4 with internal subdivision as a zigzag Elliott Wave structure.

Bitcoin 60 minutes Elliott Wave chart
Chart

Down from wave ((i)), wave (a) ended at 42333.2 and wave (b) ended at 43733.2. Wave (c) lower ended at 41856.4 which completed wave ((ii)). Bitcoin then turned higher in wave ((iii)). Up from wave ((ii)), wave (i) ended at 43448.4 and dips in wave (ii) ended at 4224. Near term, while Bitcoin stays above wave ((ii)) low, expect the crypto currency to extend higher. As far as pivot at 38503.8 low stays intact, expect pullback to find support in 3, 7, or 11 swing for further upside.

BTC/USD Elliott Wave video

Author

Elliott Wave Forecast Team

Elliott Wave Forecast Team

ElliottWave-Forecast.com

More from Elliott Wave Forecast Team
Share:

Editor's Picks

Has Bitcoin really escaped the macro forces it was built to fight?

Over 17 years ago, Satoshi Nakamoto designed Bitcoin on the back of a global financial crisis as an alternative to the global monetary system outside the control of central banks, governments and traditional intermediaries. This raises a key question: has Bitcoin really become independent of the macroeconomic forces it was built to challenge?

Ethereum activates Glamsterdam on Sepolia testnet: Why the price is falling anyway

Ethereum (ETH) has reached a key milestone in its next major network upgrade. The planned changes aim to improve Ethereum’s Layer 1 capacity and efficiency as network activity grows. The development comes as ETH retreats toward $2,500.

Bitcoin Weekly Forecast: Uptober or Rektober?

Bitcoin (BTC) price is down over 4% so far this week, trading below $83,000 at the time of writing on Friday as mounting selling pressure threatens to derail the seasonal “Uptober” rally. Profit-taking, a surge in long liquidations and weakening demand from institutional investors are weighing on BTC.

Ripple bulls gather recovery momentum amid returning ETF inflows

Ripple (XRP) trades largely in bearish hands on Friday near $1.40. Although the remittance token has stabilized after a sharp sell-off from weekly highs of $1.53 to lows around $1.32, the path of least resistance remains downward, unless buyers affirm a daily close above the pivotal $1.40 level.

Bitcoin: Uptober or Rektober?
Bitcoin (BTC) price is down over 4% so far this week, trading below $83,000 at the time of writing on Friday as mounting selling pressure threatens to derail the seasonal “Uptober” rally. Profit-taking, a surge in long liquidations and weakening demand from institutional investors are weighing on BTC.


