Solana Price Forecast: SOL holds above 50-day EMA as ETF inflows, MoneyGram integration boost outlook
- Solana holds above the key 50-day EMA at $75.53, with improving momentum indicators suggesting gains ahead.
- Solana announced MoneyGram Ramps integration, giving developers single-API access to cash-to-crypto and crypto-to-cash services.
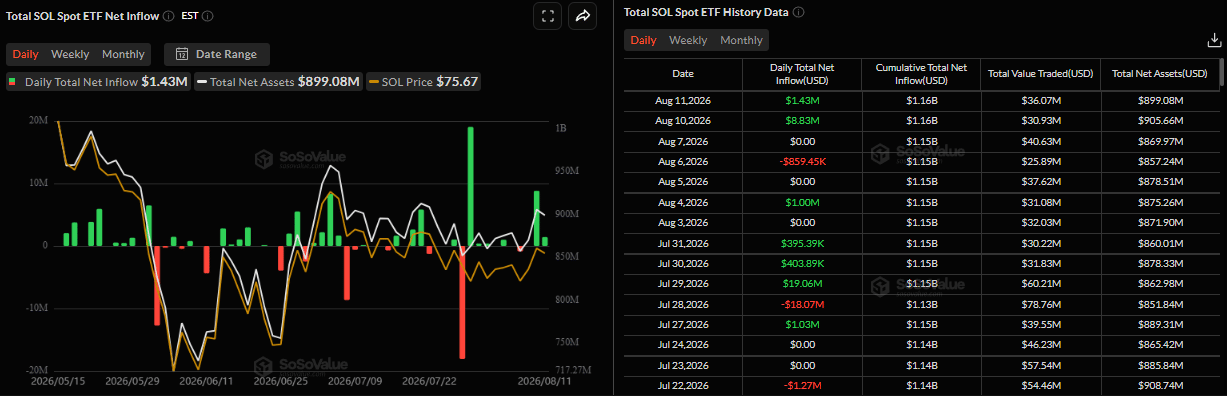
- US-listed spot Solana ETFs recorded $1.43 million in inflows on Tuesday, following $8.83 million of inflows the previous day.

Solana (SOL) extends its rebound, trading above $76.41 at the time of writing on Wednesday after finding support around the key zone the previous day. The announcement of MoneyGram Ramps integration on the network on Tuesday boosts bullish sentiment. In addition, increasing demand from institutional investors through SOL spot Exchange Traded Funds (ETFs) so far this week further supports the positive outlook.
MoneyGram integration boosts Solana’s utility
Solana announced on Tuesday that MoneyGram Ramps is live on Solana, giving builders direct access to MoneyGram’s global fiat on- and off-ramp infrastructure through a single API.
The integration brings cash deposits in over 25 countries and withdrawals in over 170 countries and territories to Solana apps, wallets, and exchanges.
“60M+ customers, nearly 500,000 retail locations, 170+ countries. One of the world’s largest payments networks is now a single API away for every builder on Solana,” said Solana on its X post.
This integration is a bullish development for SOL in the long term as it strengthens Solana’s real-world payment utility by making fiat-to-crypto and crypto-to-fiat transactions more accessible through its ecosystem. In addition, the development may also support broader adoption of Solana-based apps, wallets and exchanges by connecting them to MoneyGram’s extensive global payment network.
Institutional demand remains robust
Institutional demand for Solana has remained strong so far this week. SoSoValue data showed that SOL ETFs recorded an inflow of $1.43 million on Tuesday following a positive flow of $8.83 million the previous day. If these inflows continue and intensify throughout the week, SOL could extend gains.
Improving derivatives metrics
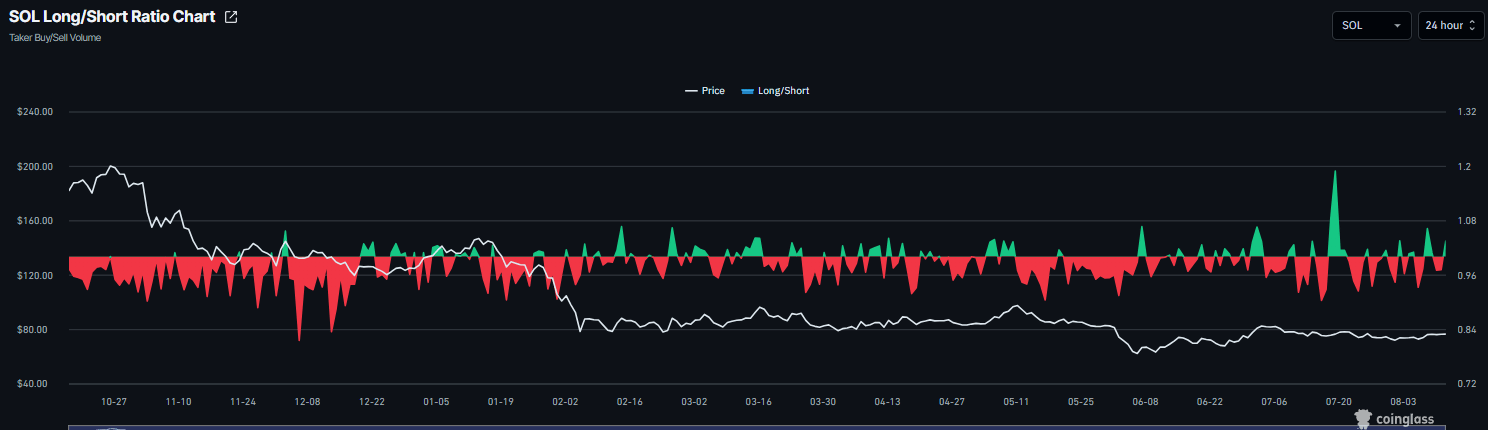
Derivatives data also shows bullish sentiment among Solana traders. CoinGlass’ long-to-short ratio for SOL reads 1.03 on Wednesday, heading toward the highest level over a month. A ratio above one indicates bullish sentiment, as traders are betting the asset price will rise.
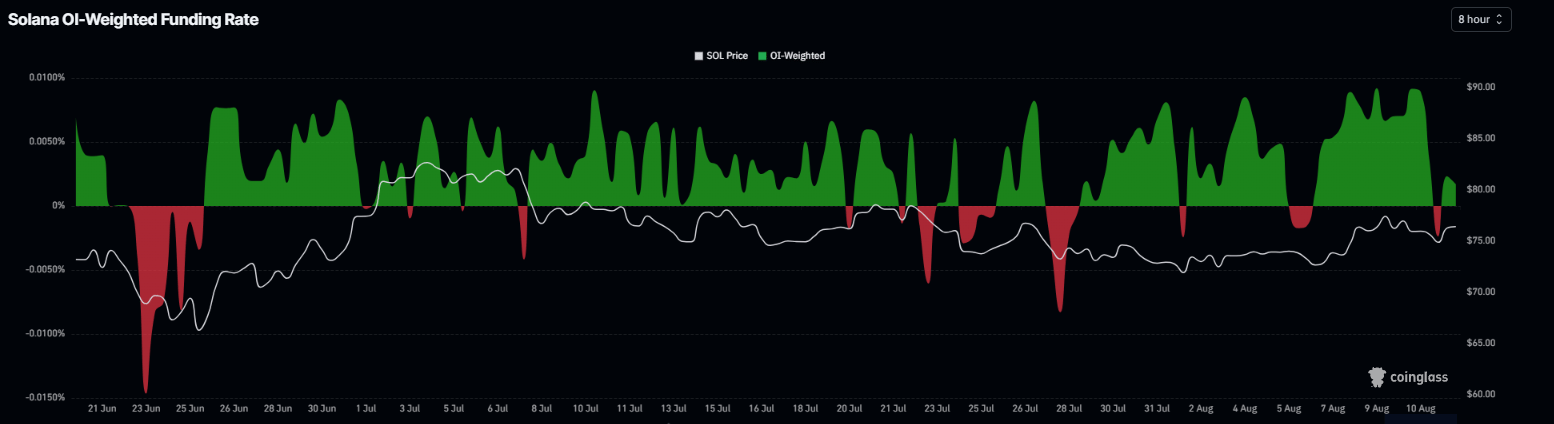
In addition, CoinGlass’ funding rates metric for Solana flipped positive on Tuesday, reading 0.0017% on Wednesday. These positive rates indicate that long traders are paying shorts and reflect a bullish bias.
Solana technical outlook: Key 50-day EMA holds as support
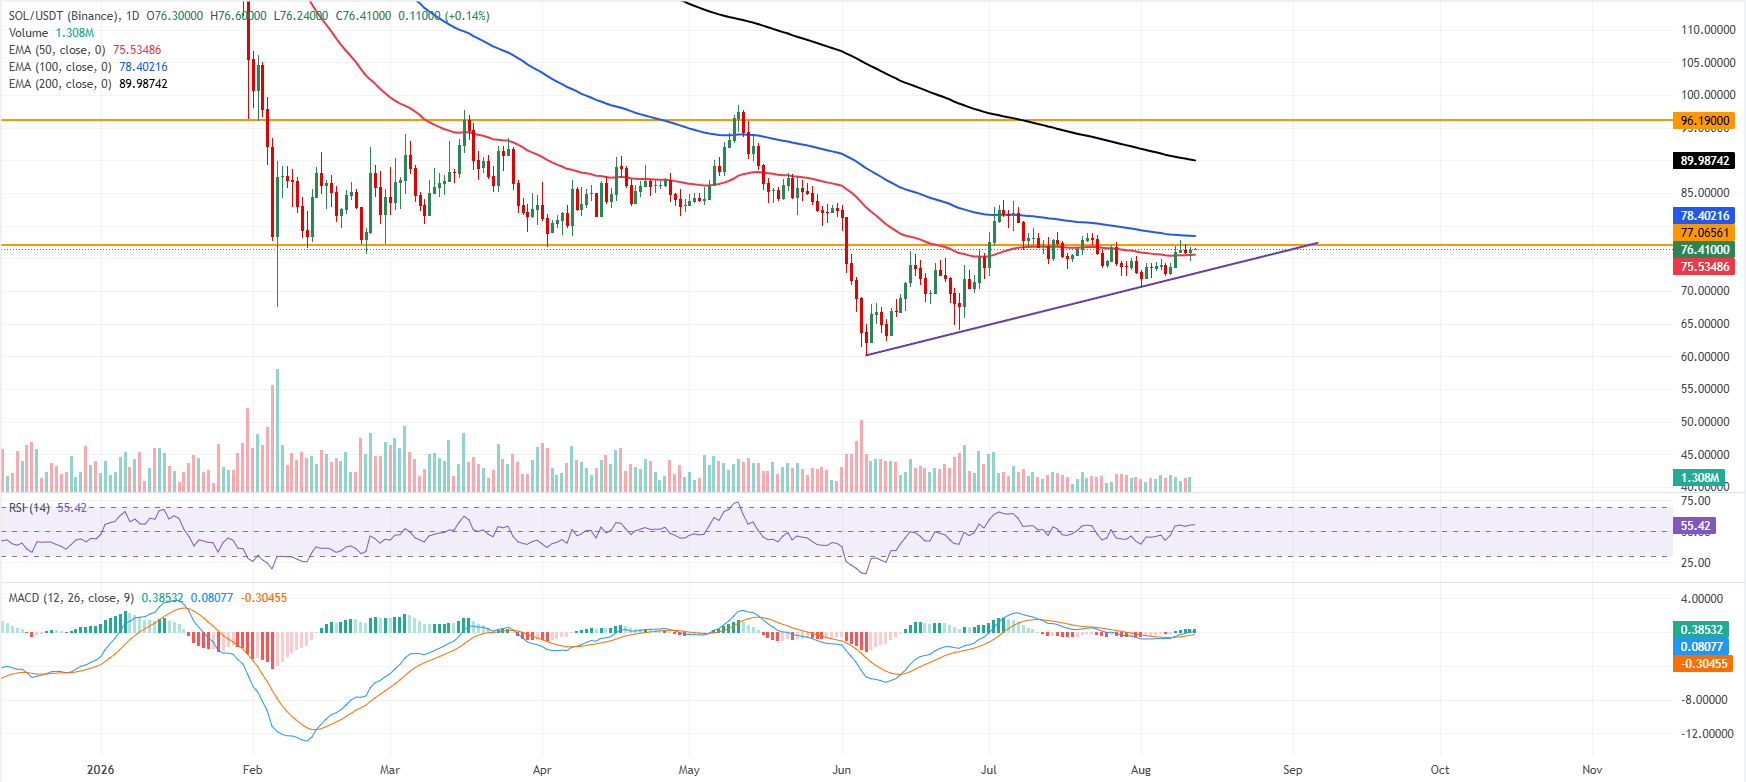
Solana price trades at $76.41 on Wednesday, maintaining a capped undertone as it holds beneath the 100-day Exponential Moving Average (EMA) at $78.40 and the longer-term 200-day EMA at $89.98. SOL price remains only marginally above the 50-day EMA support at $75.53 and the reclaimed rising trendline break area near $72.70.
Momentum has turned constructive, with the Relative Strength Index (RSI) hovering around 55 and the Moving Average Convergence Divergence (MACD) advancing further into positive territory, which hints at improving upside attempts that are still constrained by overhead structure.
On the topside, initial resistance is seen at the nearby horizontal barrier around $77.07, followed by the 100-day EMA at $78.40; above that, the 200-day EMA at $89.98 precedes a higher horizontal cap near $96.19.
On the downside, immediate support is provided by the 50-day EMA at $75.53, with the former trendline break zone around $72.70 offering a deeper structural floor should selling pressure resume.
(The technical analysis of this story was written with the help of an AI tool. Know more.)
Author

Manish Chhetri
FXStreet
Manish Chhetri is a crypto specialist with over four years of experience in the cryptocurrency industry.