Monero Price Forecast: XMR on the verge of a breakdown
- Monero near the key trendline support on Friday after declining more than 9% so far this week.
- Derivatives metrics back the bearish outlook, with open interest declining and short bets rising.
- The technical indicators continue to flash bearish signals, suggesting the risk of deeper losses ahead.

Monero (XMR) is slipping toward the key trendline support on Friday after losing over 9% so far this week. A daily close below this support zone could trigger further sell-offs. This breakdown is supported by the weakening derivatives metrics alongside bearish momentum.
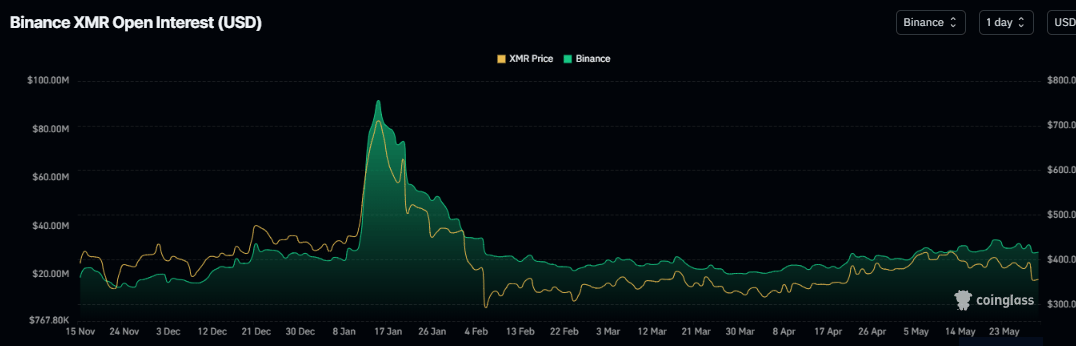
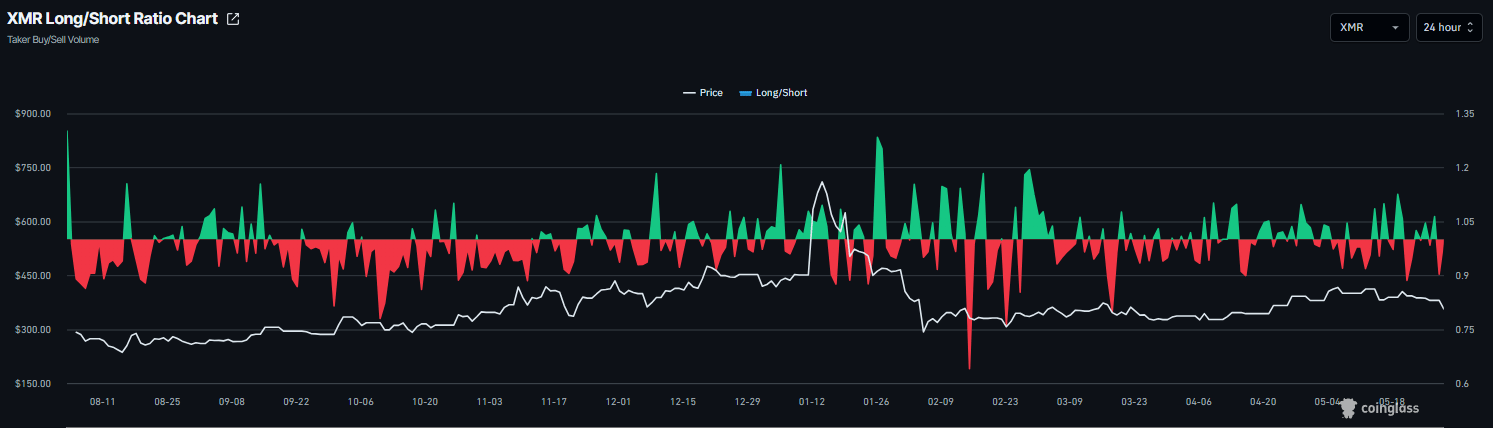
Derivatives traders turn bearish
XMR’s derivatives data supports a negative outlook. CoinGlass data shows that the futures’ Open Interest (OI) on the Binance exchange for Monero slips to $29.01 million on Friday, down from the May 21 peak of $35 million. A declining OI indicates money flowing out of the market and a reduction in new buying interest, which could weaken momentum and increase the risk of further downside in Monero price.
In addition, CoinGlass’ long-to-short ratio for Monero read 0.9 on Friday. The ratio being below one indicates bearish sentiment, as traders are betting that XMR's price will fall.
Monero Price Forecast: XMR slides toward critical support after sharp weekly losses
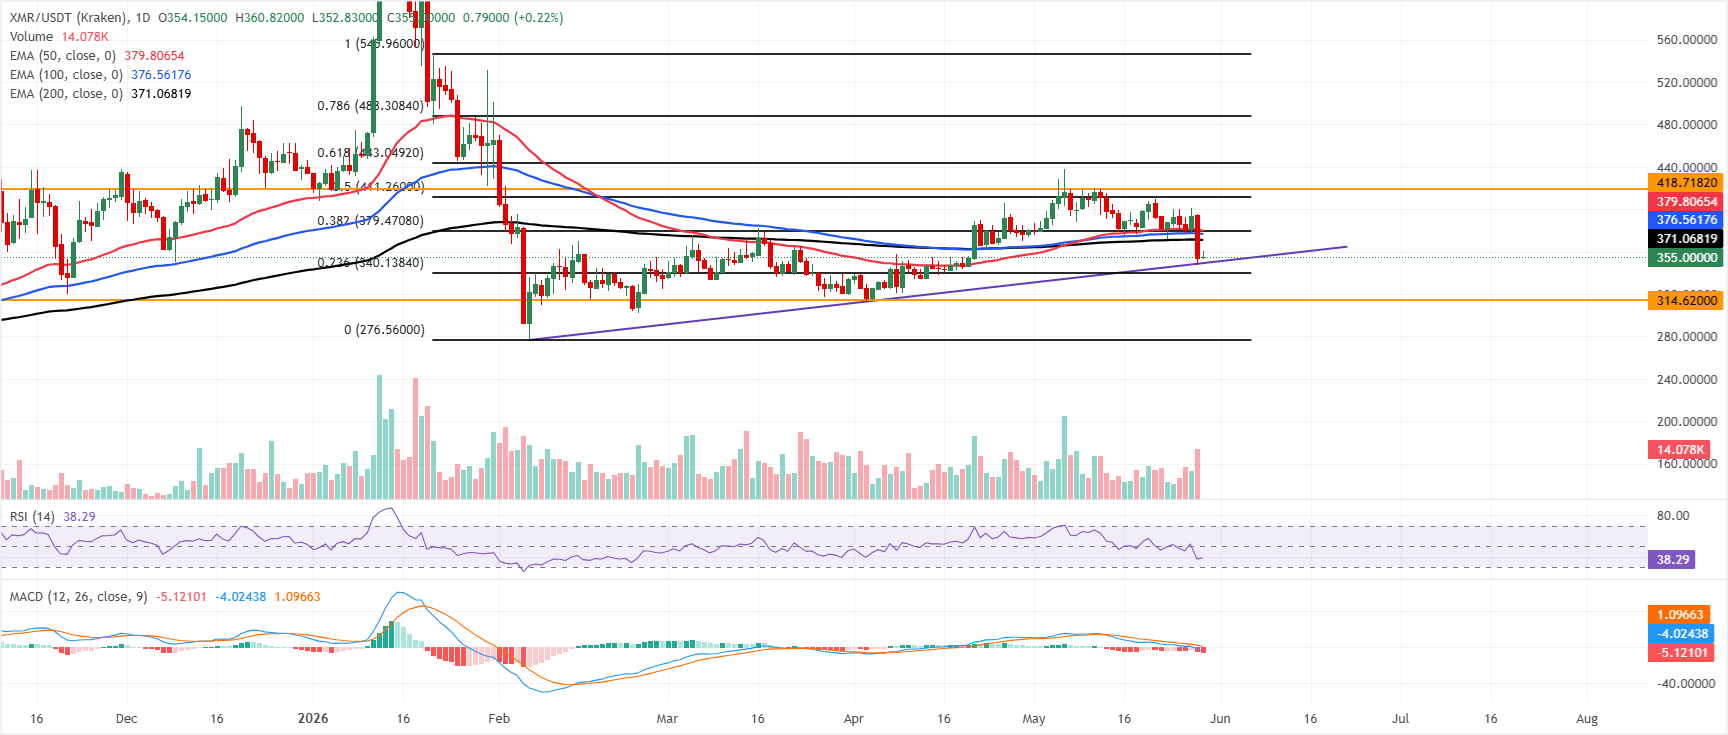
Monero price trades at $355, maintaining a bearish near-term tone as it holds below the 50-day, 100-day and 200-day Exponential Moving Averages (EMAs), clustered between roughly $371 and $380.
The Relative Strength Index (RSI) on the daily chart, at about 38, signals weak momentum but stops short of oversold territory, while the Moving Average Convergence Divergence (MACD) remains below zero, suggesting downside pressure is still dominant despite some prior stabilization.
On the topside, initial resistance is seen at the 200-day EMA around $371.06, followed by the 100-day EMA at $376.56 and the 38.2% Fibonacci retracement of the latest swing at $379.47, with the 50-day EMA just above at $379.80 forming a dense supply band. Further hurdles emerge at the 50% retracement at $411.26 and the horizontal barrier near $418.72.
On the downside, immediate support aligns with the rising trendline area around $349.02, ahead of the 23.6% Fibonacci retracement level at $340.14; a clearer bearish extension would open the way toward the more distant horizontal floor at $314.62.
(The technical analysis of this story was written with the help of an AI tool.)
Author

Manish Chhetri
FXStreet
Manish Chhetri is a crypto specialist with over four years of experience in the cryptocurrency industry.


