Crypto Overview: Zcash, Bittensor, and Ethereum stall after a mild rebound
- Bitcoin holds above $63,000 on Monday following a 4% rebound the previous day.
- Data reveal a spike in short liquidations over the past 24 hours amid a broader market rebound.
- Zcash, Bittensor, and Ethereum stall on Monday after leading a mild rebound on Sunday.

The broader cryptocurrency market shows a stalled rebound on Monday after Friday's crash linked to the US Jobs data release, raising concerns about a rate hike. Bitcoin hovers above $63,000 at press time on Monday, while Zcash (ZEC), Bittensor (TAO), and Ethereum (ETH) emerge as top performers over the last 24 hours.
The short-term rebound fuels hope
The broader cryptocurrency market recovered on Sunday, with Bitcoin rebounding 4% after a brief slip below $60,000 on Friday. Although the risk of a potential rate hike amid steady institutional outflows weighs on Bitcoin, the mild recovery reinforces the bullish stronghold around $60,000.
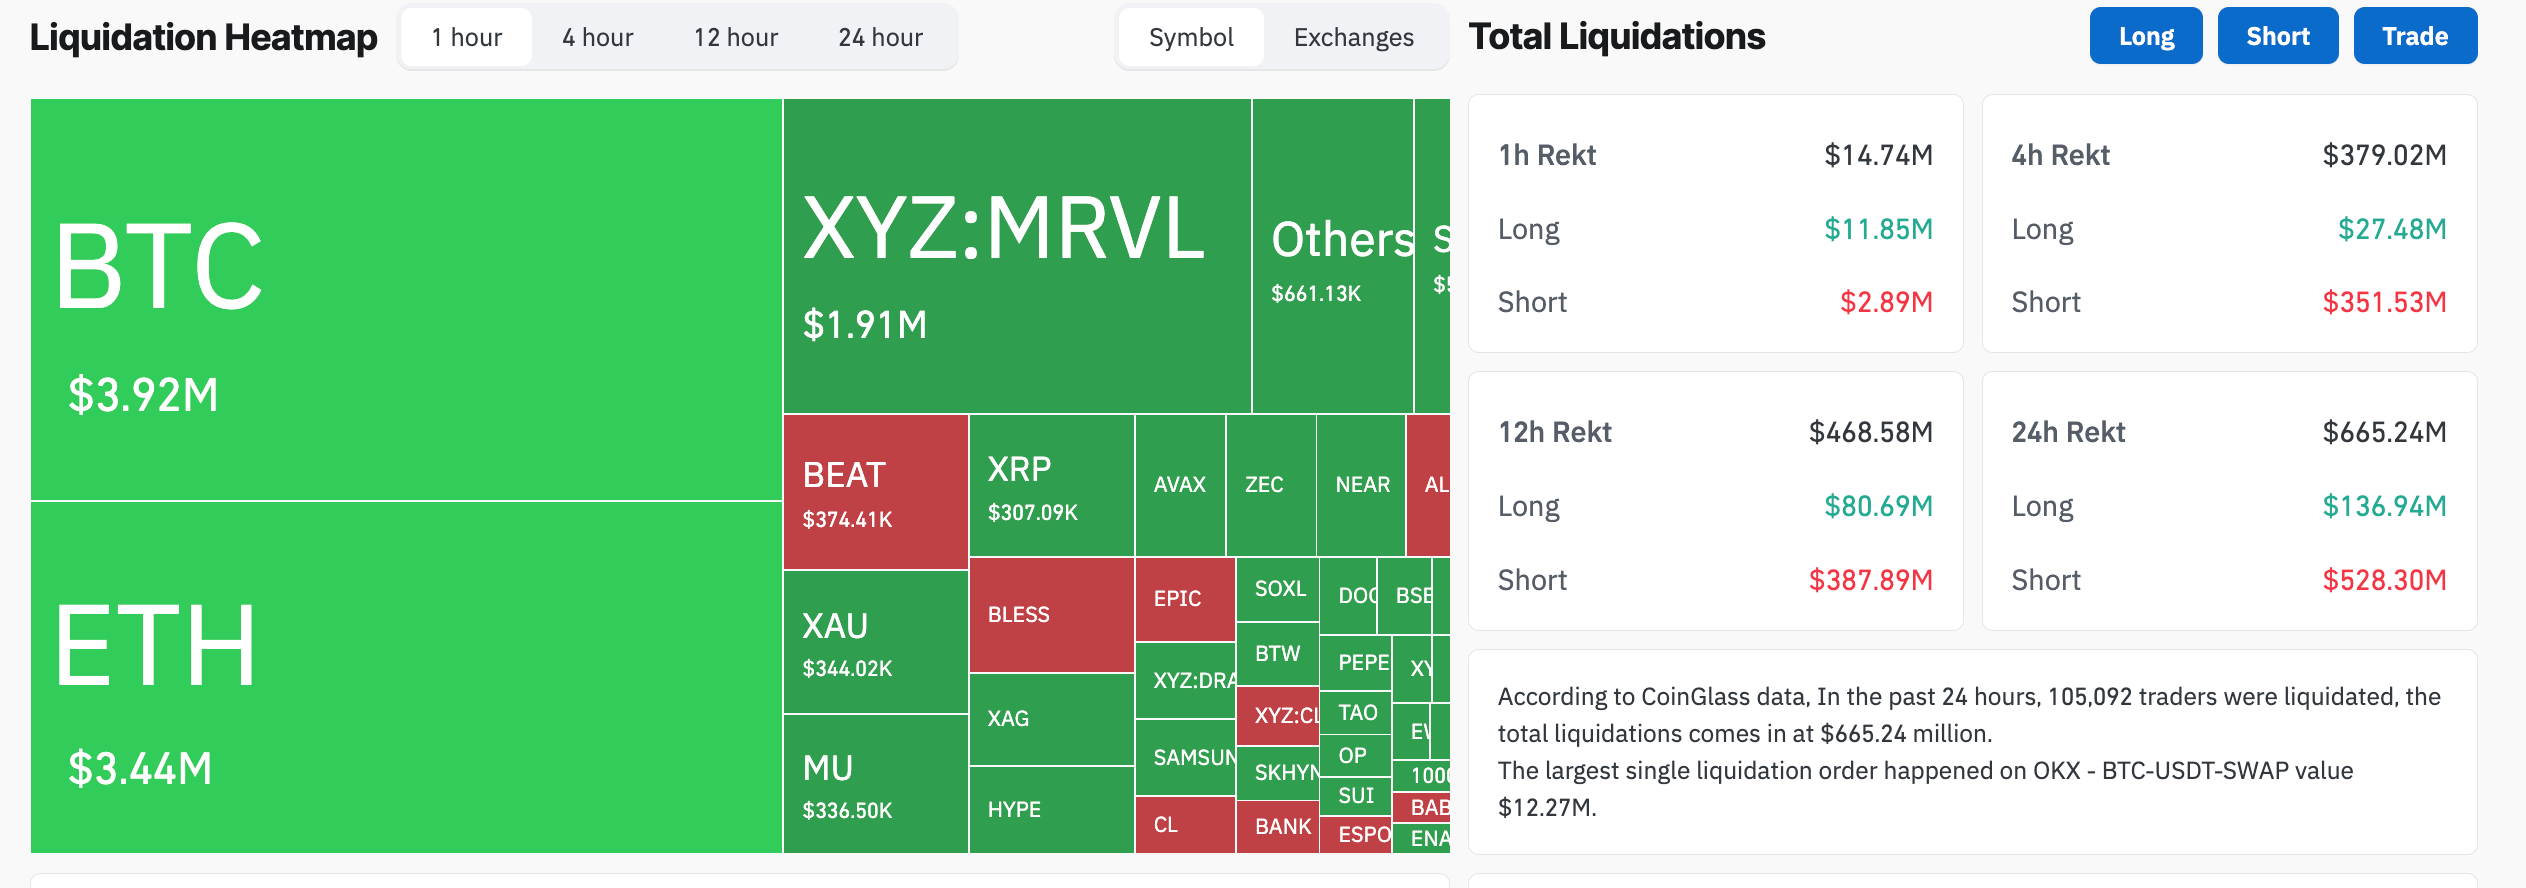
CoinGlass data show that $665 million was liquidated over the last 24 hours, led by $528 million in short liquidations, reflecting a mild upside bias in the short term.
Zcash, Bittensor, and Ethereum stall after a mild rebound
Zcash hovers above $400 at press time on Monday, resurfacing above its 100-day Exponential Moving Average (EMA) at $428 after a 21% rebound from its 200-day EMA at $364. Still, the privacy coin is capped beneath the 50-day EMA at $485 and tests the 61.8% Fibonacci retracement level at $438, measured over the downswing from $750 to $184.
A decisive close above this zone could test the 50-day EMA at $485, followed by the $500 psychological threshold.
That said, the Relative Strength Index (RSI) near 42 on the daily chart maintains a clear downward trend while the negative Moving Average Convergence Divergence (MACD) falls below its zero line as the bearish profile expands, suggesting a bearish tone.
Looking down, immediate support comes from the 100-day EMA at $428, ahead of a structural band around the 50% retracement at $372, with deeper protection from the 200-day EMA at $364 if selling pressure accelerates.
Bittensor hovers above $200 on Monday after a 10% rebound on the previous day, but keeps a bearish bias as price remains clearly below the 50-day, 100-day, and 200-day EMAs clustered between roughly $257 and $270.
The RSI is at around 36, remaining in weak territory but above oversold levels, while the MACD remains negative, suggesting downside momentum is still dominant.
Initial resistance emerges at the lost support level of $236. However, to ease current bearish pressure, TAO should surpass the dense supply band formed by the 50-, 100-, and 200-day EMAs around $256, $259, and $269, respectively.
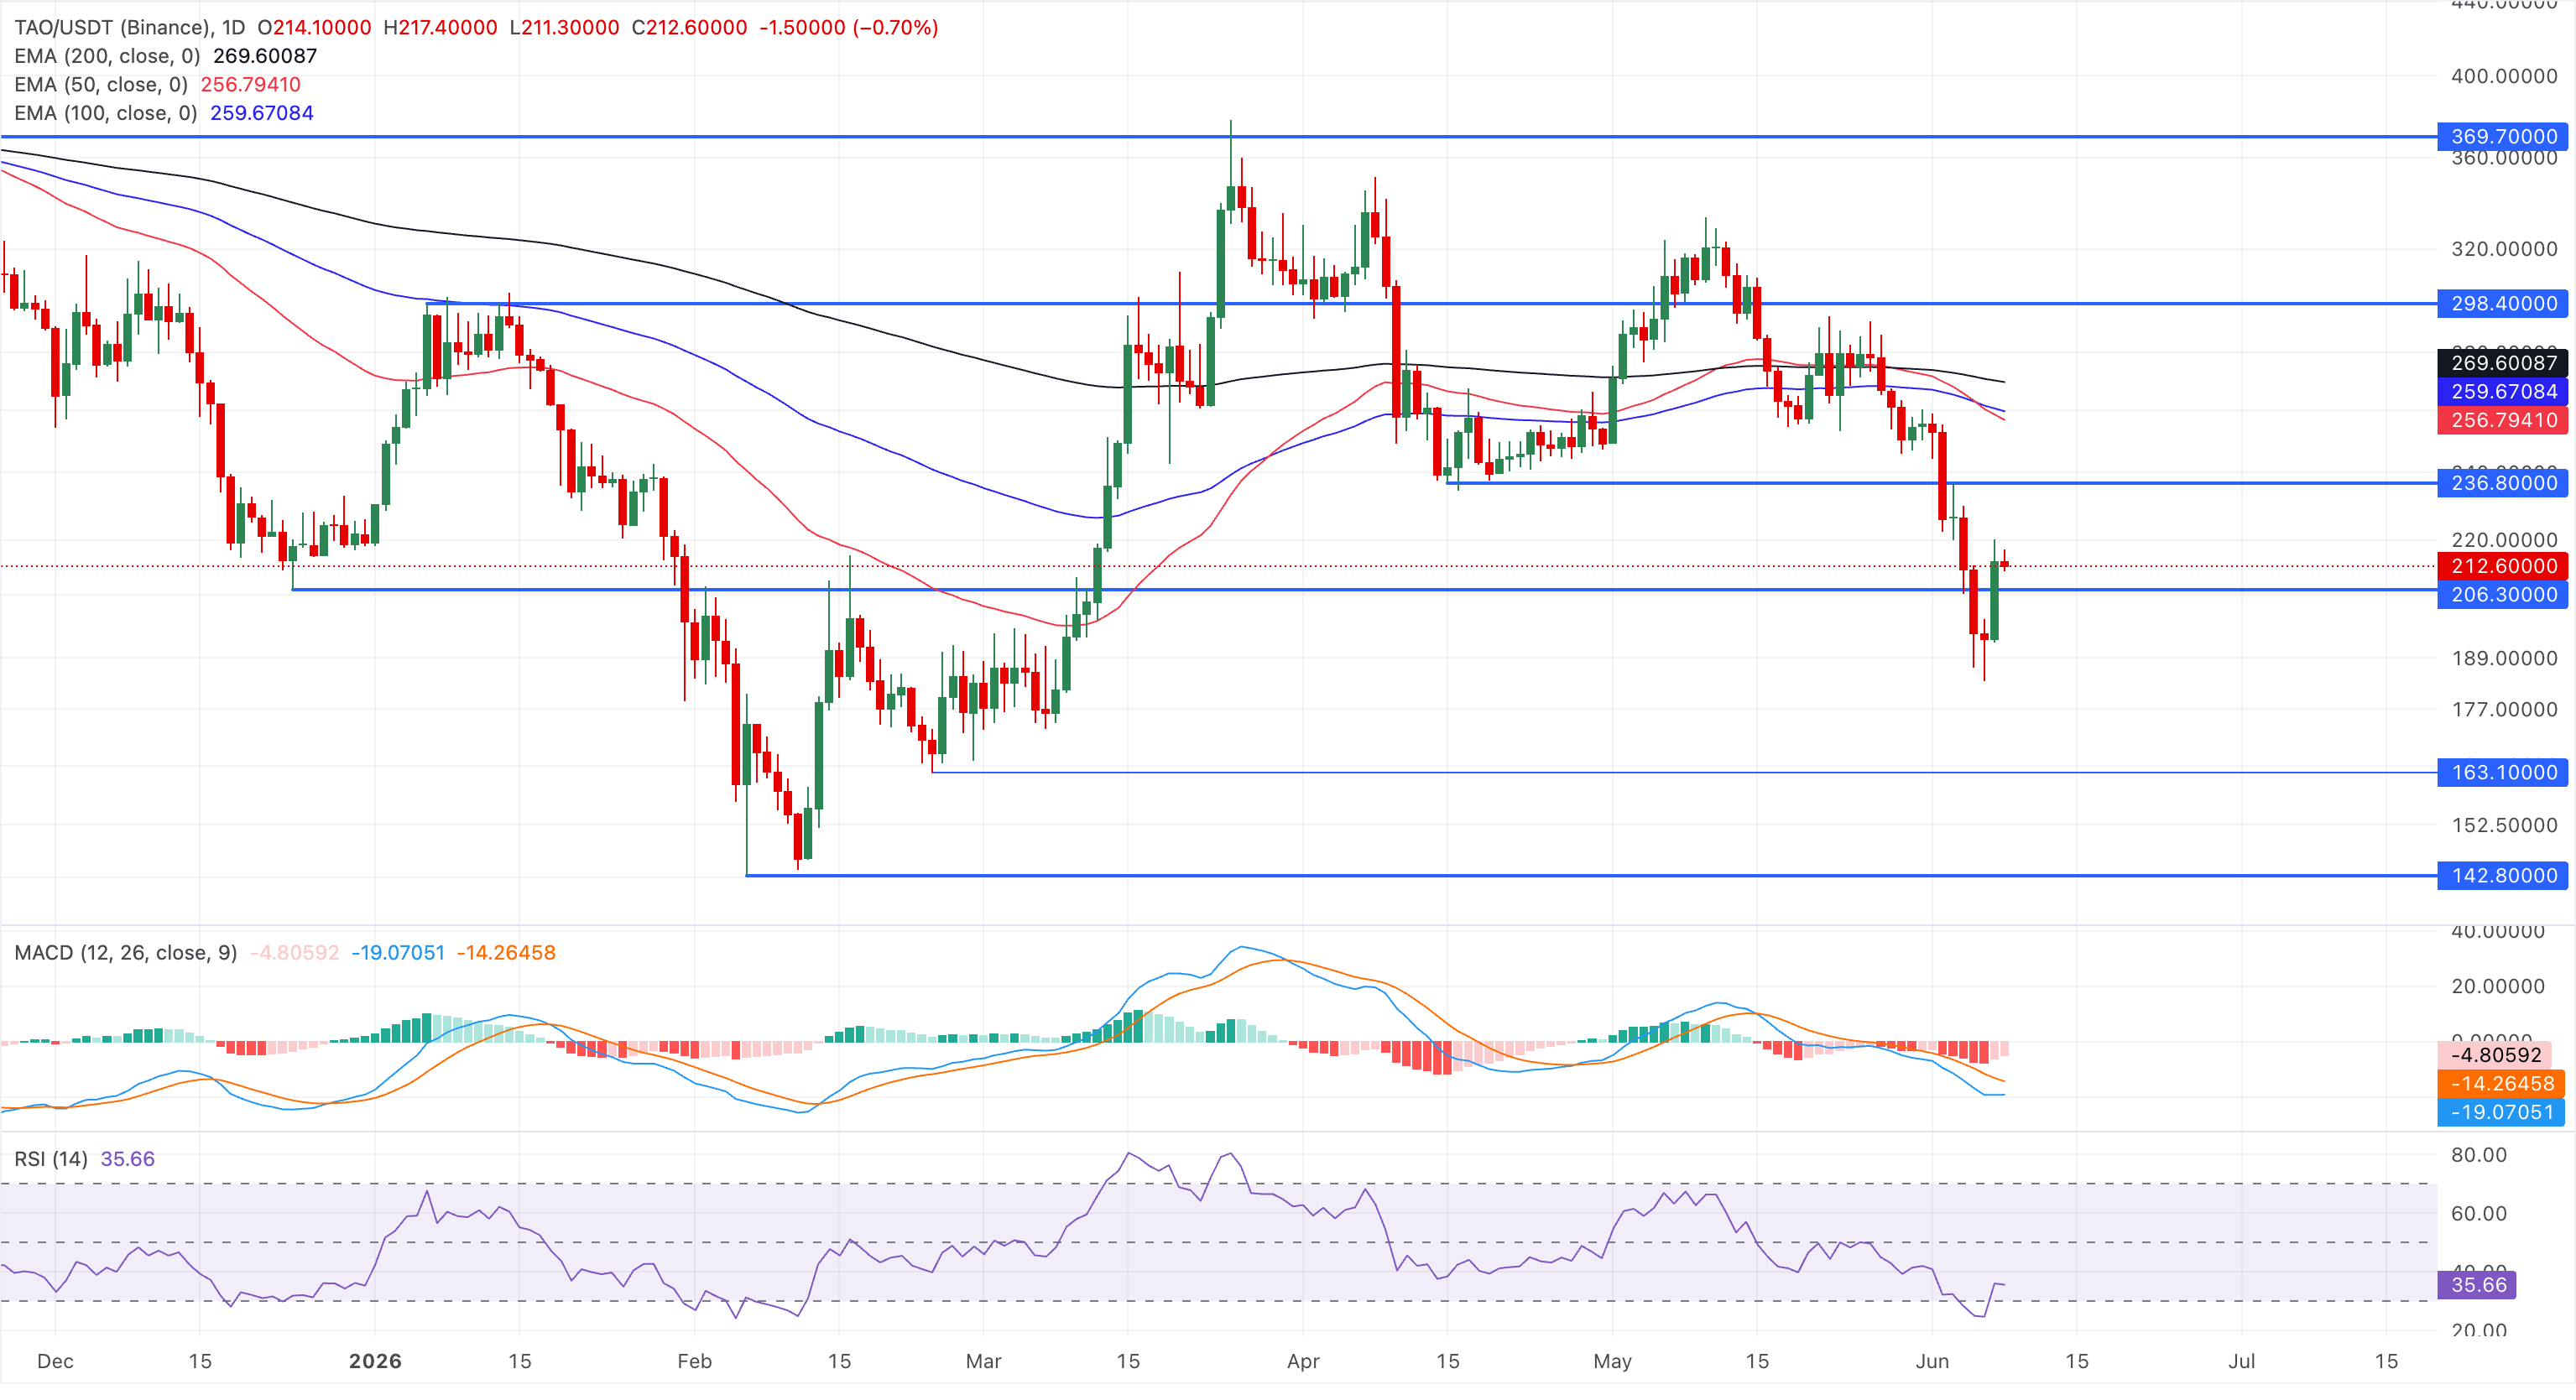
On the downside, another slip below $200 could risk a steeper decline toward the February 24 low of $163.
Ethereum hovers below $1,700 at press time on Monday, maintaining a clear bearish bias after collapsing well below its major 50-day, 100-day, and 200-day EMAs, which cluster overhead and suggest the broader trend remains under heavy downside pressure.
The MACD and signal lines sit deep in negative territory as the negative histogram expands, hinting that bearish momentum remains dominant even as the RSI at 28 signals oversold conditions.
On the topside, initial resistance emerges at the February 6 low of $1,747, followed by the 50-day EMA near $2,058.
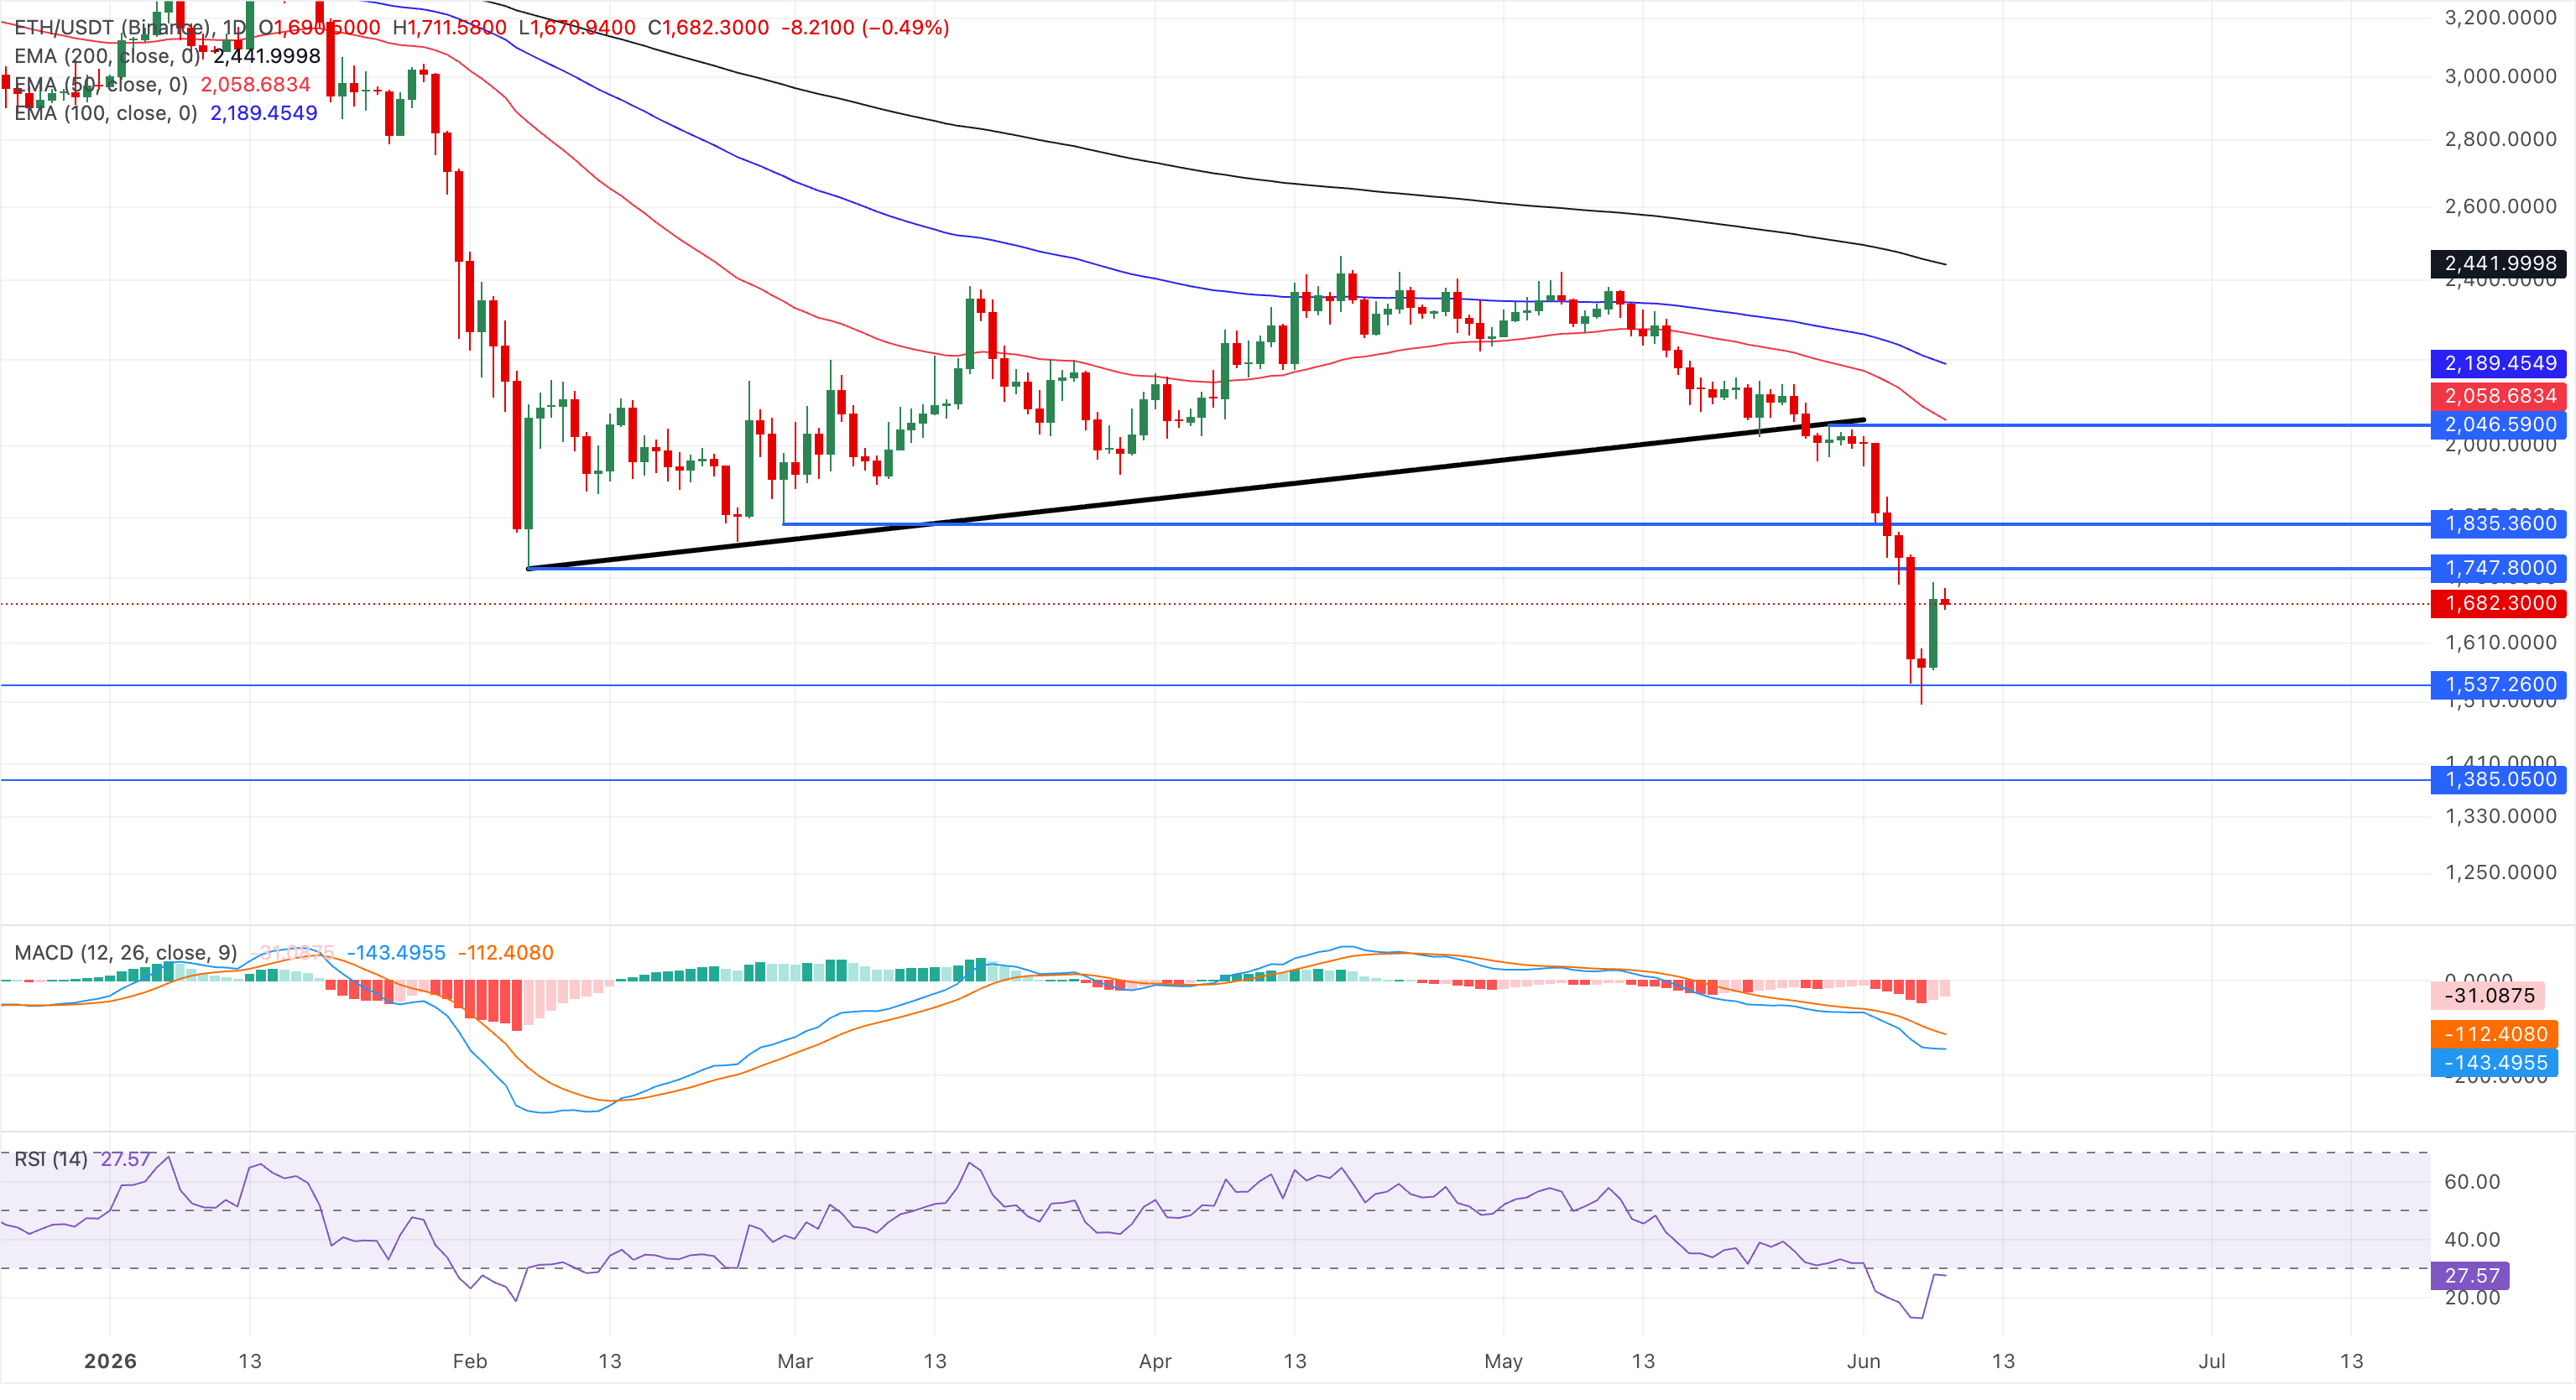
Looking down, a slip below the April 22, 2025, low of $1,537 could pave the downside path toward the April 9, 2025 low at $1,385.
(The technical analysis of this story was written with the help of an AI tool.)
Author

Vishal Dixit
FXStreet
Vishal Dixit holds a B.Sc. in Chemistry from Wilson College but found his true calling in the world of crypto.