XAU/USD Elliott Wave forecast accuracy: Capturing over 1460 points lower

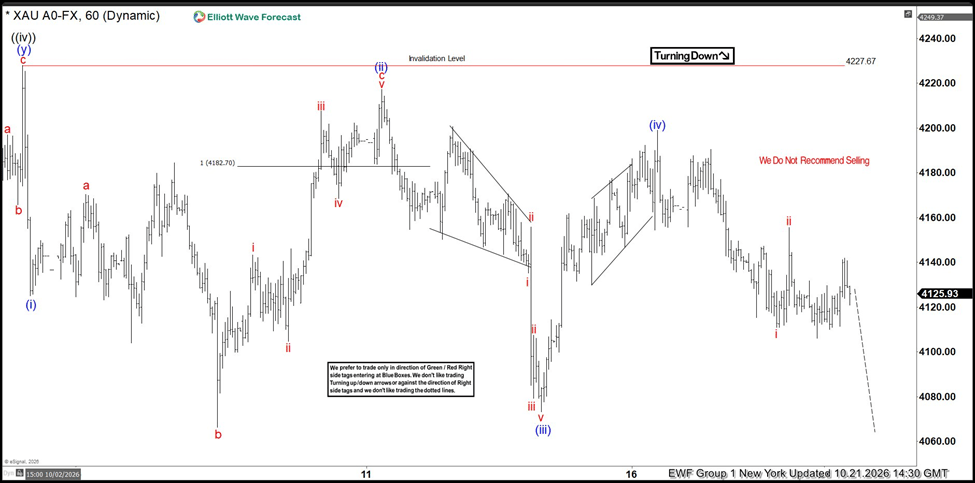
On October 21, 2026, we published our Elliott Wave forecast for Gold (XAUUSD), identifying a potential downside move while price was trading around 4,125. Our analysis outlined a bearish scenario, with Gold expected to continue lower following a corrective recovery.
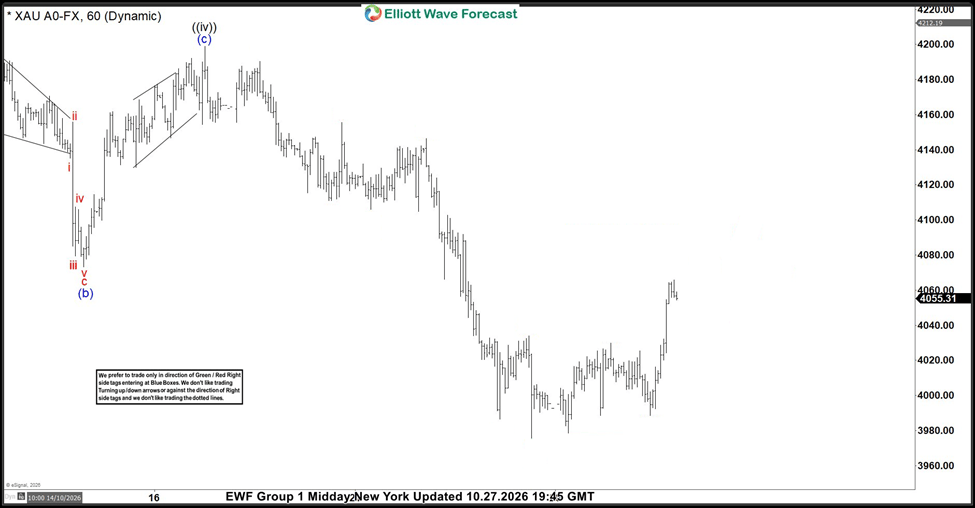
What followed was a substantial decline, with Gold falling toward the 3,980 region before staging a rebound toward 4,060. The move demonstrated the importance of identifying market structure, defining invalidation levels, and remaining focused on the prevailing Elliott Wave count.
The forecast: 10.21.2026
In our original 60-minute XAUUSD chart, we were tracking the development of a larger corrective structure following Gold’s earlier advance. Our Elliott Wave count suggested that the market was progressing through a bearish sequence, with the potential for another impulsive leg lower.
The chart highlighted a key invalidation level at 4,227.67. A break above this level would invalidate our immediate bearish scenario. We also emphasized that traders should not rush into selling but should wait for the appropriate setup in line with our analysis.
Our forecast was not simply a prediction that Gold would fall. It was a structured scenario with a defined invalidation level and an anticipated downside path.
The outcome: 10.27.2026
The subsequent price action, shown in our October 27 update, revealed a substantial decline from the October 21 price region.
Gold moved from approximately 4,125.93 to a low near 3,980, representing a decline of roughly 146 price points. Depending on the broker’s quotation convention, this equates to approximately 14,600 points when one point is defined as 0.01. See below
Note: Certain labels have been intentionally concealed to protect the exclusivity of our members.
Following this decline, Gold staged a sharp corrective rebound toward the 4,060 area. This illustrates how corrective recoveries can develop even after a strong bearish move.
Elliott Wave analysis: Why structure matters
Elliott Wave analysis helps us identify recurring price structures and develop potential market scenarios. In this case, our October 21 chart identified a bearish setup and outlined the possibility of further downside.
The subsequent decline was consistent with our directional expectation. However, a forecast should not be judged solely by whether the market moved in the anticipated direction. Entry timing, risk management, the validity of the wave count, and the distinction between projected and realized prices are equally important.
This is why we use invalidation levels. They establish the point at which an analysis must be reconsidered, helping us remain objective as market conditions change.
Forecasting before the move
The key takeaway from this XAUUSD example is the importance of publishing a technical scenario before the anticipated move unfolds.
Our October 21 chart documented the bearish outlook, the invalidation level at 4,227.67, and the projected downside path. The October 27 update subsequently showed Gold trading significantly lower.
This is an example of how a structured Elliott Wave framework can help traders prepare for potential market movements instead of reacting only after a significant move has already occurred.
Final thoughts
Gold’s subsequent decline highlights the importance of market structure, clearly defined invalidation levels, and disciplined execution.
We identified the bearish scenario on October 21, 2026, and Gold subsequently moved sharply lower. Our follow-up chart documented the decline and the corrective rebound that followed.
Our objective remains consistent: identify the most probable market structure, map out potential price paths, define what would invalidate the analysis, and let price action determine whether the forecast remains valid.
Author

FXStreet Insights Team
FXStreet
The FXStreet Insights Team is a group of journalists that handpicks selected market observations published by renowned experts. The content includes notes by commercial as well as additional insights by internal and external analysts.