WTI tests physical demand as growth expectations lose momentum

Key takeaways
- WTI has moved below the $82.96–$83.00 participation zone, extending its retreat toward the structural support area around $81.50.
- Softer US growth expectations are transmitting into fuel-consumption assumptions, freight activity and broader energy-demand projections.
- US crude inventories recently declined by 7.2 million barrels, while elevated refinery margins continue to signal tight conditions across refined-product markets.
- The Renko chart shows ECRO and Delta ECRO at zero within a Compression regime, indicating limited directional participation near an increasingly important support area.
WTI enters the demand-validation phase
WTI begins Friday’s session with markets evaluating how slower economic momentum could propagate through transportation activity, industrial fuel consumption and physical crude balances.
Thursday’s US data introduced a more cautious growth profile. Advance GDP expanded by 1.5% quarter over quarter, below the 2.1% consensus shown in the economic calendar, while monthly Core PCE increased by 0.1%, also below expectations.
For crude oil, the importance of these releases develops through their influence on real economic activity. Freight movement, manufacturing output, aviation demand and consumer mobility collectively determine how macroeconomic growth reaches physical fuel consumption.
The current transmission sequence is:
Growth Momentum
↓
Transportation and Industrial Activity
↓
Energy Demand
↓
Physical Balances
↓
WTI Participation
This sequence has become increasingly visible as WTI retreats from the latest rally and investors evaluate whether physical tightness can continue supporting prices through a softer growth environment.
Economic composition shapes energy consumption
Headline GDP establishes the broad direction of economic activity. The composition of that growth provides a more precise signal for energy markets.
Consumer activity influences gasoline demand and aviation flows. Manufacturing affects diesel consumption, petrochemical feedstock demand and industrial logistics. Business investment supports construction, machinery use and freight movement.
A slowdown concentrated in energy-intensive areas can transmit rapidly into crude demand expectations. Resilience across transportation and industrial production can preserve physical consumption even as aggregate growth moderates.
WTI therefore functions as a real-economy market. Its participation structure reflects expectations surrounding barrels consumed, refined, stored and transported across the global system.
The weaker GDP release has increased the importance of upcoming activity indicators. Employment conditions, manufacturing surveys and transportation data will help determine whether the latest slowdown represents a broader loss of momentum or a temporary moderation within an expanding economy.
Inventories continue validating the physical layer
Recent US inventory data provide an important counterweight within this macro sequence.
The latest reported decline of 7.2 million barrels in US crude inventories exceeded market expectations and reflected stronger refinery demand alongside lower imports. This draw suggests that physical crude availability tightened during the reporting period, reinforcing the connection between refinery utilisation and domestic balances.
Inventory movements remain one of the clearest mechanisms through which expected demand becomes observable physical participation.
Persistent draws indicate that refiners and end users are absorbing available supply. Inventory rebuilding points toward improving availability, softer refinery intake or weaker consumption.
WTI is currently processing softer growth expectations alongside a recent confirmation of physical demand through the inventory channel.
That interaction explains the market’s elevated volatility. Macro expectations are moderating while parts of the physical system continue signalling constrained availability.
Refining margins extend the demand signal
The refining system represents another central layer in the present WTI structure.
Reuters reports that refinery outages and attacks affecting facilities in the Middle East and Russia have tightened global supplies of diesel, gasoline and jet fuel. European diesel-processing margins reached record territory, while gasoline and jet-fuel margins also remained historically elevated. US crack spreads have recorded similarly strong levels.
Valero reported record second-quarter earnings as higher refining margins and strong international fuel demand supported its refining operations. The company increased average throughput to approximately 3 million barrels per day, reinforcing the relationship between product-market tightness and crude intake.
These margins encourage refiners to maintain high utilisation whenever operational capacity and crude availability permit.
The resulting transmission chain develops through:
Product Availability
↓
Refining Margins
↓
Refinery Throughput
↓
Crude Demand
↓
WTI Physical Balances
Households, freight operators, airlines and industrial systems consume refined products. Conditions in gasoline, diesel and jet-fuel markets therefore provide a direct signal regarding the strength of end-use demand and the availability of processing capacity.
Shipping flows reshape supply continuity
WTI is also absorbing developments across the global logistics system.
Reuters reports that crude and LNG traffic through major Middle Eastern routes has improved, helping stabilise supply expectations following recent disruptions. Freight rates, insurance premiums and geopolitical risks remain elevated as shipping companies navigate the Strait of Hormuz, the Red Sea and the Gulf of Aden.
Improved vessel traffic supports the continuity of physical supply. Higher transportation and insurance costs continue affecting delivered barrel economics and regional pricing.
WTI consequently reflects several connected physical variables:
- production availability;
- refinery demand;
- inventory coverage;
- shipping continuity;
- freight and insurance costs;
- refined-product consumption.
The interaction among these variables determines whether softer growth expectations ultimately generate looser balances.
Technical structure
The Renko chart shows a clear loss of short-term participation following the recovery from the $79.68 structural support area.
WTI previously advanced toward $85.90–$86.00, where the rally lost momentum and a reversal marker developed. Price subsequently moved below the short-term EMA9 and EMA21, confirming a progressive weakening of the latest recovery structure.
The decline has now carried WTI through the closely aligned $82.96–$83.00 participation zone.
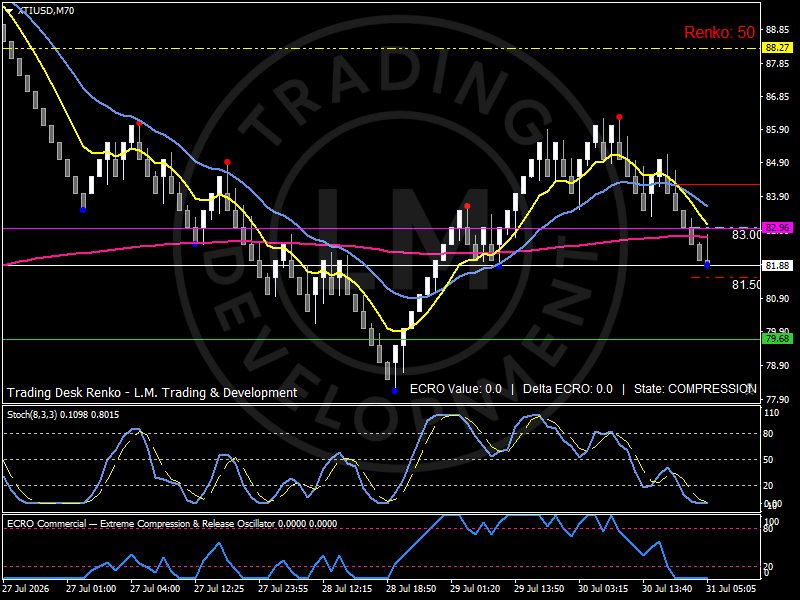
This area contains the longer-term moving average and previously acted as an important equilibrium level. The move below it places immediate attention on $81.50, which represents the next visible structural support on the chart.
The EMA configuration has also deteriorated. The EMA9 has rolled below the EMA21, while both averages are turning lower above current price. The long-term average near $82.96 now forms an overhead participation threshold.
The stochastic oscillator has moved deeply into its lower range, with both lines near the floor of the indicator. This reading confirms severely reduced short-term momentum following the latest decline.
The ECRO reads 0.0, while Delta ECRO also stands at 0.0. The model classifies the market state as COMPRESSION.
This combination indicates that directional participation has contracted as WTI approaches support. The market has absorbed the previous expansion and is building a concentrated decision area between $81.50 and $83.00.
A sustained recovery above $82.96–$83.00 would return price toward the moving-average cluster around $83.80–$84.20. Continued acceptance below the current zone would increase attention on $81.50, followed by the broader structural floor near $79.68.
Bird’s eye view
Market Regime: Demand Validation.
Macro Transmission: Growth → Energy Demand → Physical Balances → WTI Participation.
Physical Transmission: Product Tightness → Refining Margins → Throughput → Crude Demand.
Immediate Support: $81.50.
Structural Support: $79.68.
Participation Threshold: $82.96–$83.00.
Upper Resistance: $83.80–$84.20.
ECRO State: Compression.
Primary Drivers: US Growth · Inventories · Refining Margins · Shipping Flows · Freight Costs.
Outlook
WTI enters the final session of the week at the intersection of softer growth expectations and still-constrained physical energy markets.
The latest US data have lowered expectations for economic momentum, creating a more selective outlook for transportation and industrial fuel demand. Recent inventory draws, elevated refining margins and continued logistics risks preserve underlying pressure across the physical system.
The Renko chart captures this transition through a break below the $82.96–$83.00 participation zone and a fully developed Compression regime near $81.50 support.
The next phase will depend on how economic activity translates into refinery throughput, inventory changes and end-user fuel consumption. Those physical signals will determine whether WTI rebuilds participation above equilibrium or extends its adjustment toward the broader structural support area.
Author

Luca Mattei
LM Trading & Development
Luca Mattei is a market analyst focusing on FX, metals, and macroeconomic trends. He develops trading tools for retail and professional traders, coding indicators and EAs for MT4/MT5 and strategies in Pine Script for TradingView.