Weekly data – Oil and Gold: Price review for the week ahead

This preview of weekly data examines USOIL and XAUUSD, with economic data expected later this week as the primary market drivers of the near-term outlook.
Highlights of the week: RBA rate decision, US services PMI, Canada unemployment rate & US job report
Tuesday
- Reserve Bank of Australia Interest rate decision at 4:30 AM GMT is expected to increase from 4.10% to 4.35%. If this is confirmed, it would be the third rate hike in 2026 and could potentially create some gains for the Aussie against its pairs.
- US Services PMI at 14:00 GMT for April. The consensus is for a slight decrease of 0.2 points, reaching 53.8. This might be rather bullish news for the Dollar since it would mean that the services sector in the States is still expanding for the whole of 2026 so far.
Thursday
- Australian Balance of trade at 01:30 AM GMT, where the expectations are for a decrease reaching A$4.45 billion in trade surplus. This might not have a significant effect on the Aussie Dollar since the data are for the month of March and might already have been priced in.
Friday
- The Canadian unemployment rate at 12:30 PM GMT. The market is expecting the figure to remain stable at 6.7% for the month of April.
- The US Job report at 12:30 PM GMT, where the non-farm payrolls and unemployment rate are going to be published. The expectations for the NFP are for an increase to reach 178,000 against the previous recording of 73,000. If these expectations are correct, we might see that the dollar could move up in various pairs in the aftermath of the release. On the other hand, the unemployment rate is expected to remain static at 4.3%.
USOIL, daily
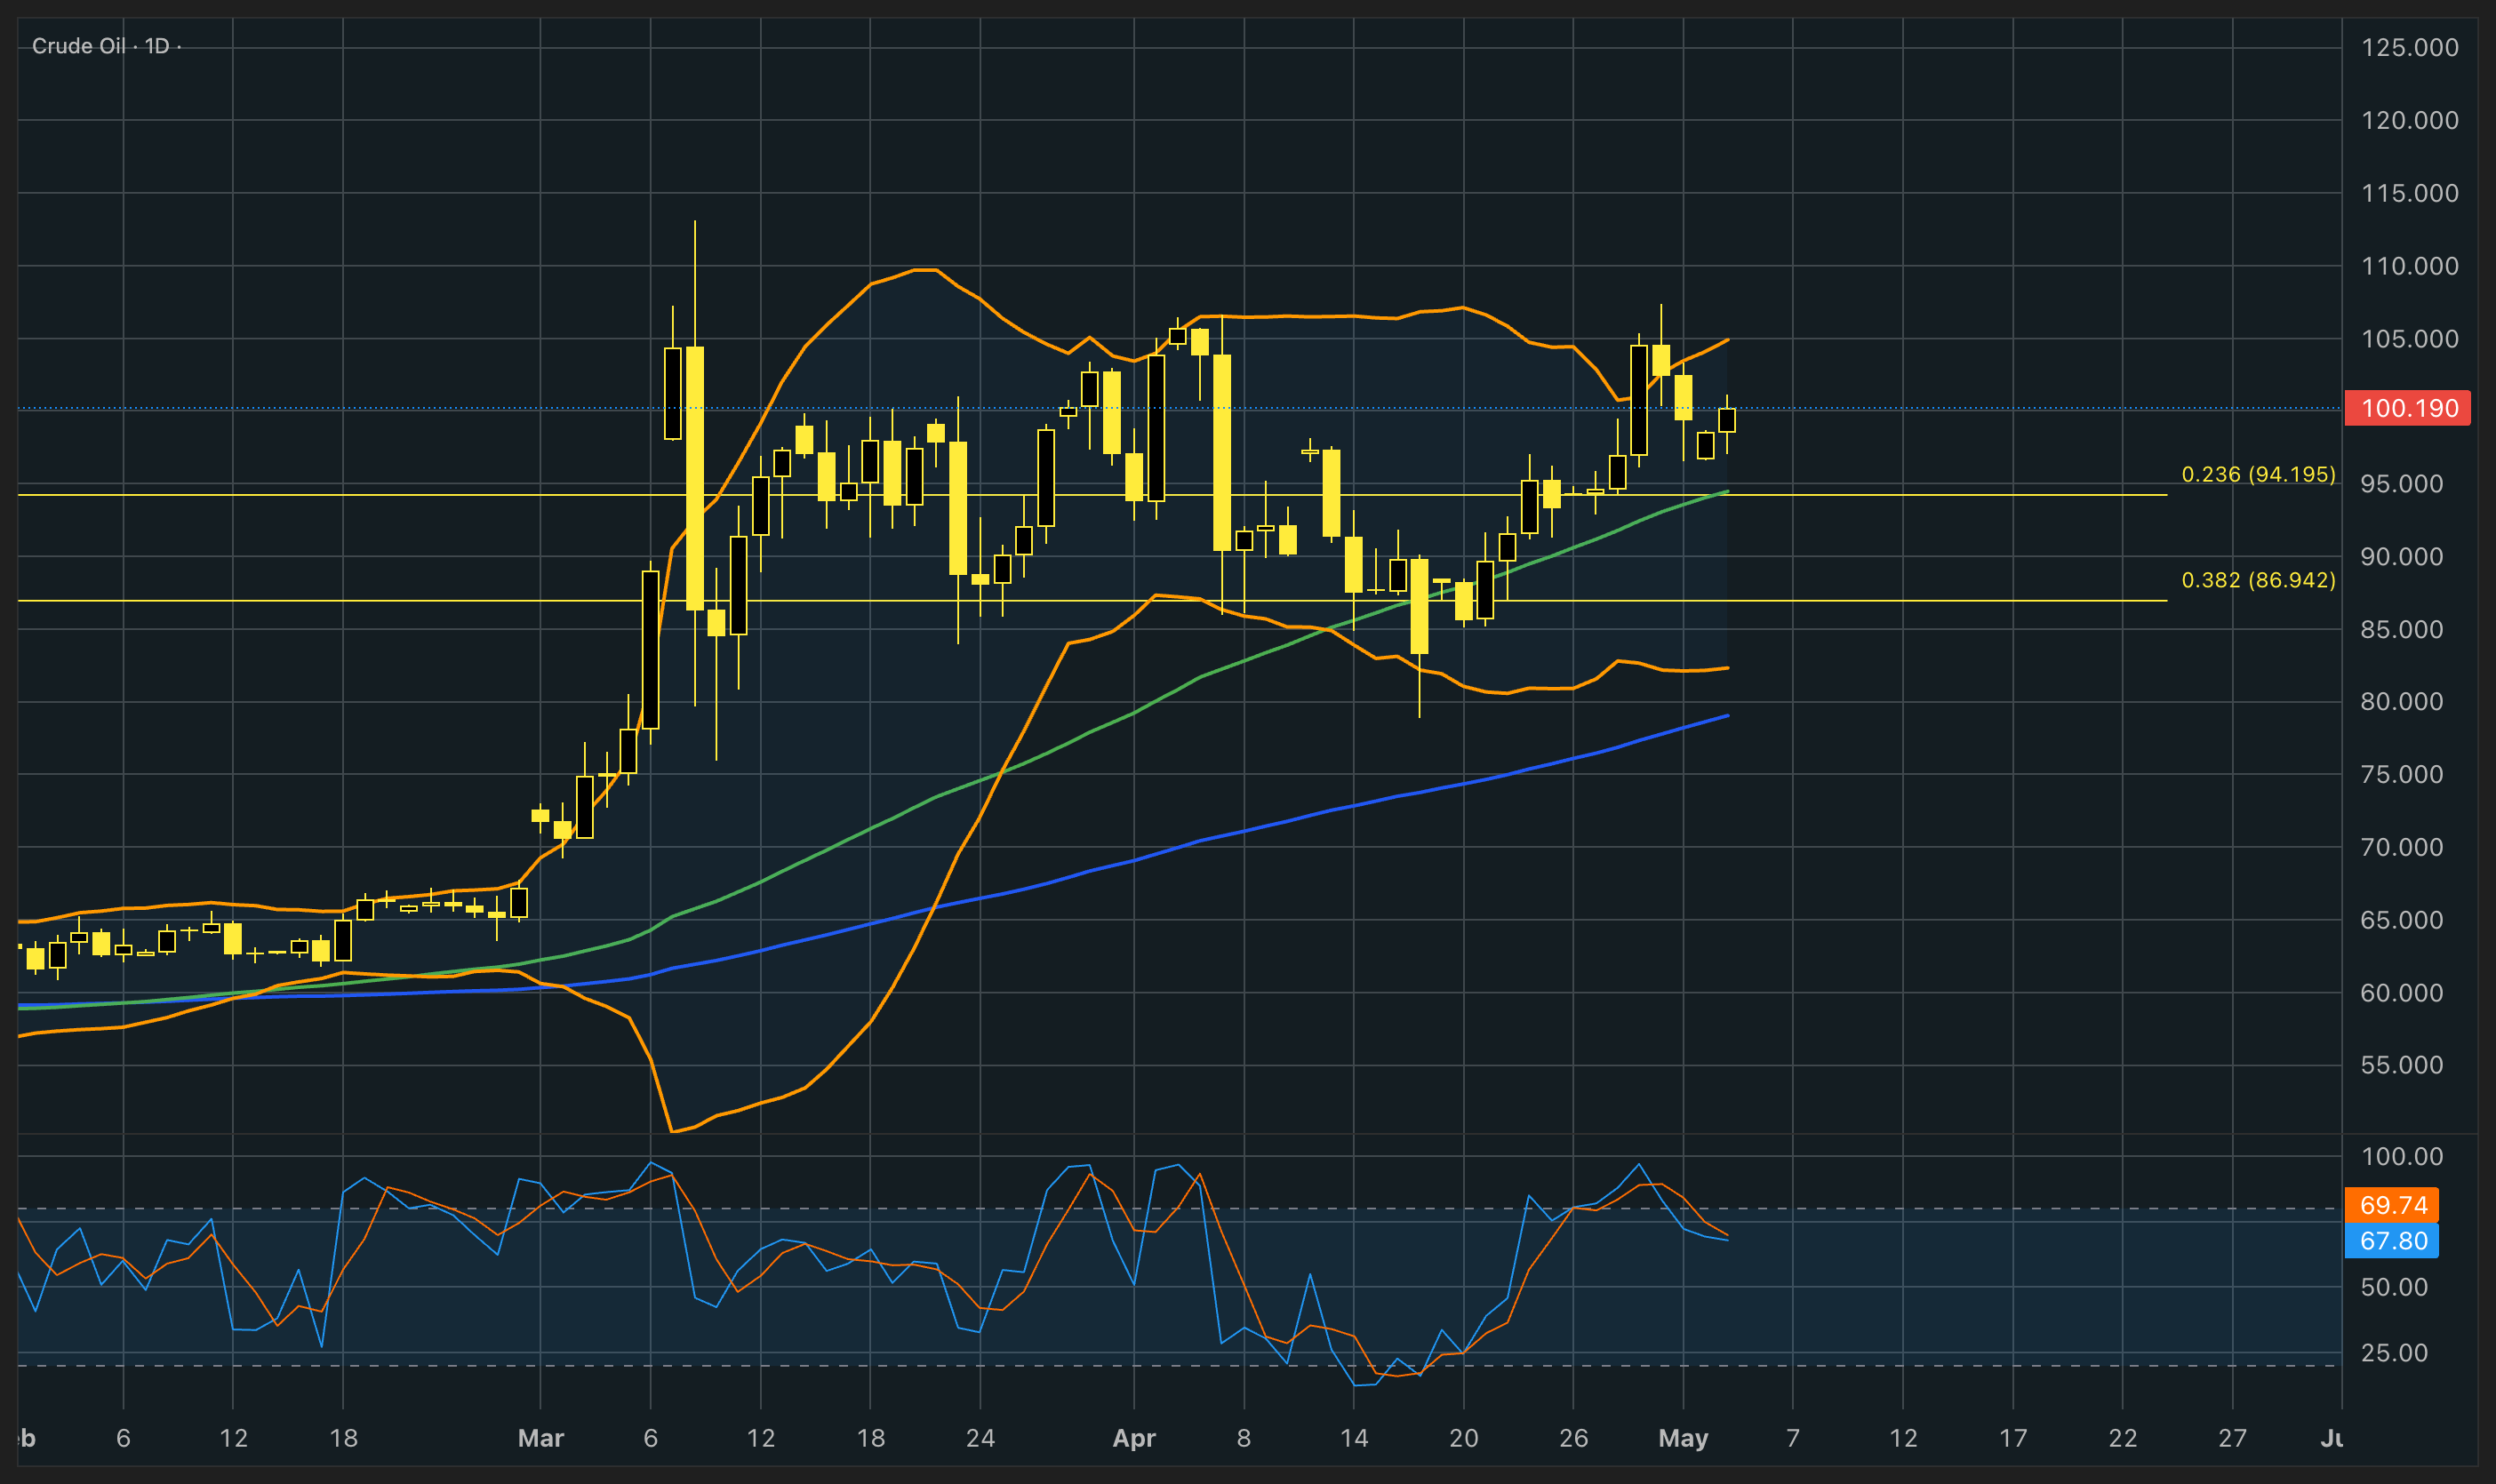
Oil prices steadied after early swings as traders questioned whether a US plan to guide neutral ships through the Strait of Hormuz would actually work. The initiative, led by Donald Trump, is meant to unblock vessels stranded by the conflict with Iran, but a reported tanker strike in the region immediately underscored how fragile the situation remains.
While the US has pledged military support, the lack of direct naval escorts has raised doubts about the plan’s effectiveness. Markets reflected that skepticism, with initial price drops fading quickly as traders showed little conviction that the proposal would materially improve supply conditions. Ongoing disruptions in the Gulf, driven by a de facto standoff between Washington and Tehran, continue to restrict flows and support prices. Iran has warned that any US interference could breach ceasefire terms, while pressure on its oil sector is building as storage fills up.
The strain is expected to intensify if disruptions persist, with the market eventually forced to adjust through higher prices or shortages. Meanwhile, OPEC+ has signaled business as usual with a modest planned output increase, though it does little to offset current risks.
On the technical side, the price found sufficient support on the 23.6% Fibonacci retracement level early last week and has since corrected to the upside. The Stochastic oscillator is back to neutral levels, indicating potential for sharp moves in the upcoming sessions. The moving averages are still validating the overall bullish trend, while the Bollinger Bands remain quite expanded, indicating that there is volatility to support any sharp short-term moves. For the time being, the area of $94 is the major technical support area on the chart, consisting of the 23.6% Fibonacci retracement level as well as an area of price reaction in the past month.
Gold-Dollar, daily
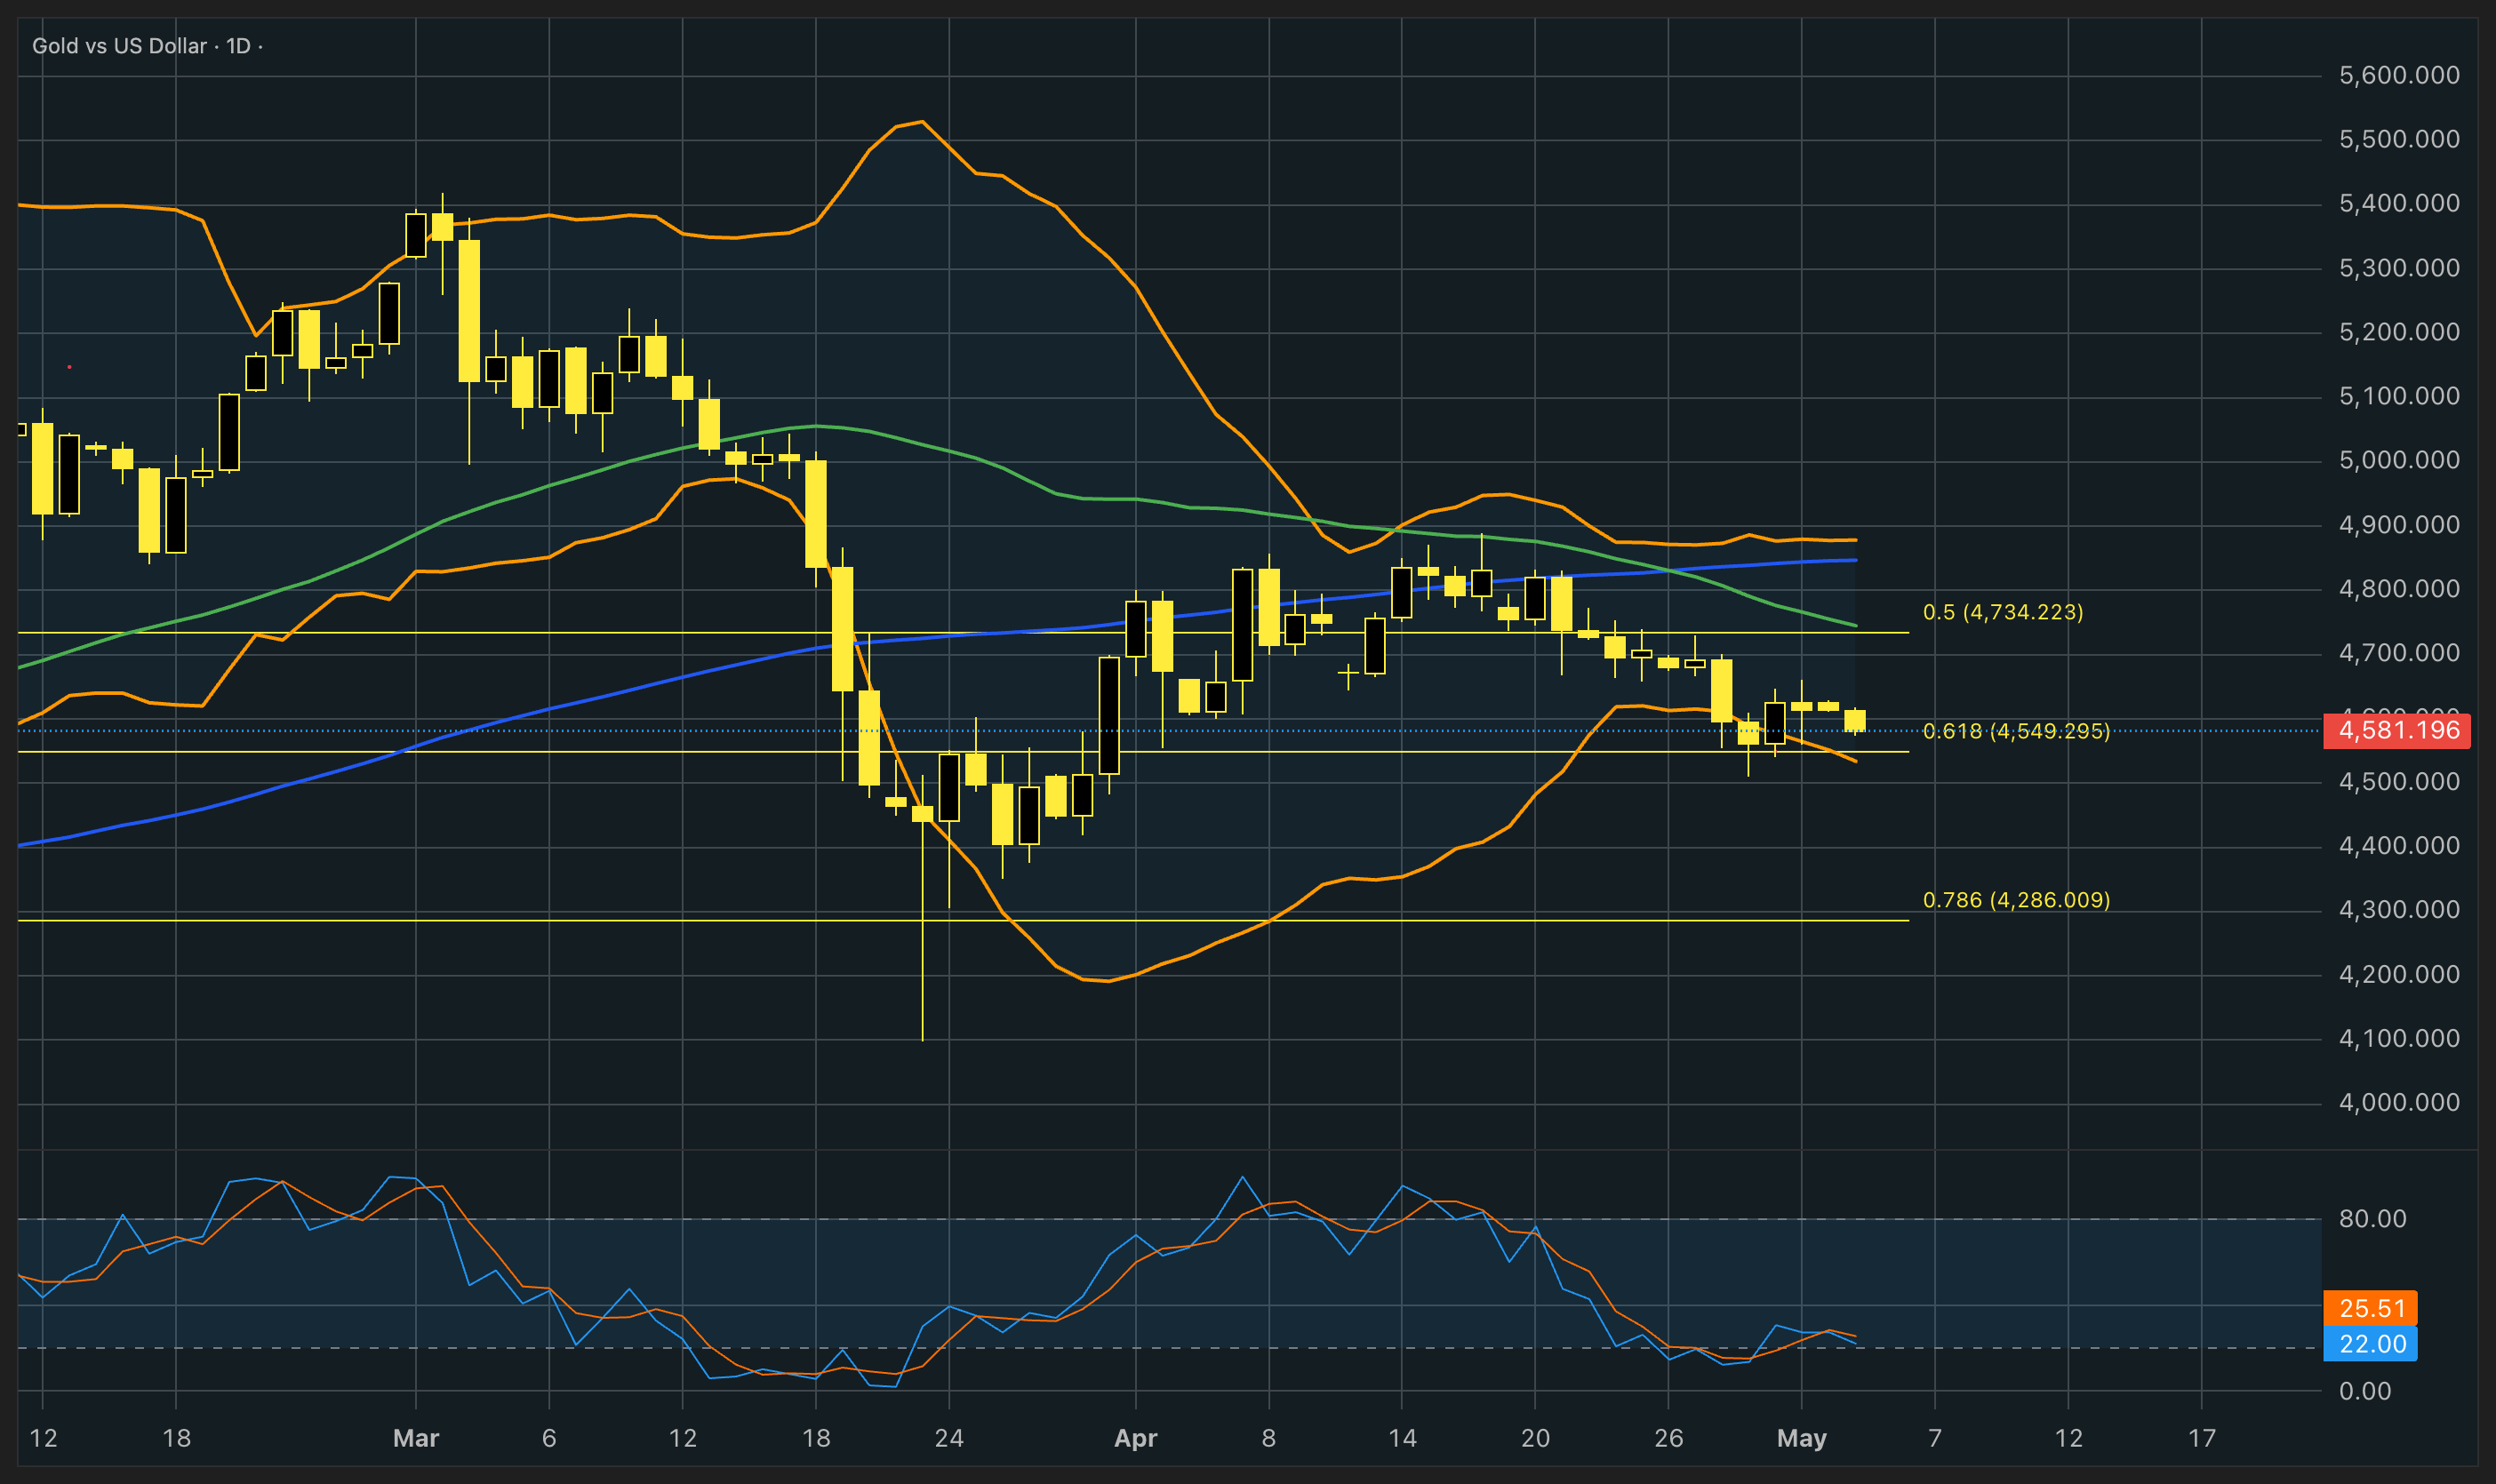
Gold fell for a second straight week as traders weighed progress toward a US-Iran deal and shipping plans in the Strait of Hormuz. Prices came under pressure after Donald Trump signaled the US would guide some vessels through the region, easing immediate risk concerns.
The bigger driver is macro, with higher energy prices fueling inflation, pushing central banks toward a more hawkish stance, and reducing expectations for rate cuts, which is an overall negative setup for gold. A stronger dollar is adding further pressure on the price and could drive it lower in the near term.
Focus now shifts to upcoming US data and signals from the Federal Reserve. Despite the pullback, longer-term demand remains supported by continued buying from central banks and large players like Tether Holdings SA.
From a technical point of view, the gold price has been declining at a steady pace since mid April and is currently testing the support of the 61.8% Fibonacci retracement level. The moving averages have recently crossed and are now validating a bearish trend in the market, while the Bollinger Bands have somewhat expanded, but still not enough volatility for the price to perform any significant sharp moves. The Stochastic oscillator is showing extreme oversold conditions; therefore, the overall picture on gold seems to be forming a bullish setup either for a correction or a complete reversal. If this scenario is confirmed, then the first major technical resistance level might be seen around $4,800, which is the psychological resistance of the round number as well as the 50% Fibonacci retracement level.
Author

Antreas Themistokleous
Exness
Antreas has been trading CFDs since 2018 using a combination of fundamental and technical analysis.















