USD/CHF Elliott Wave forecast: Dollar rally continues

Executive summary
- Trend Bias: Upward trend in Elliott wave 3rd wave.
- Key Levels: Bullish above 200-day simple moving average.
- Target Zone: Wave (iii) near .8212.
Current Elliott Wave analysis
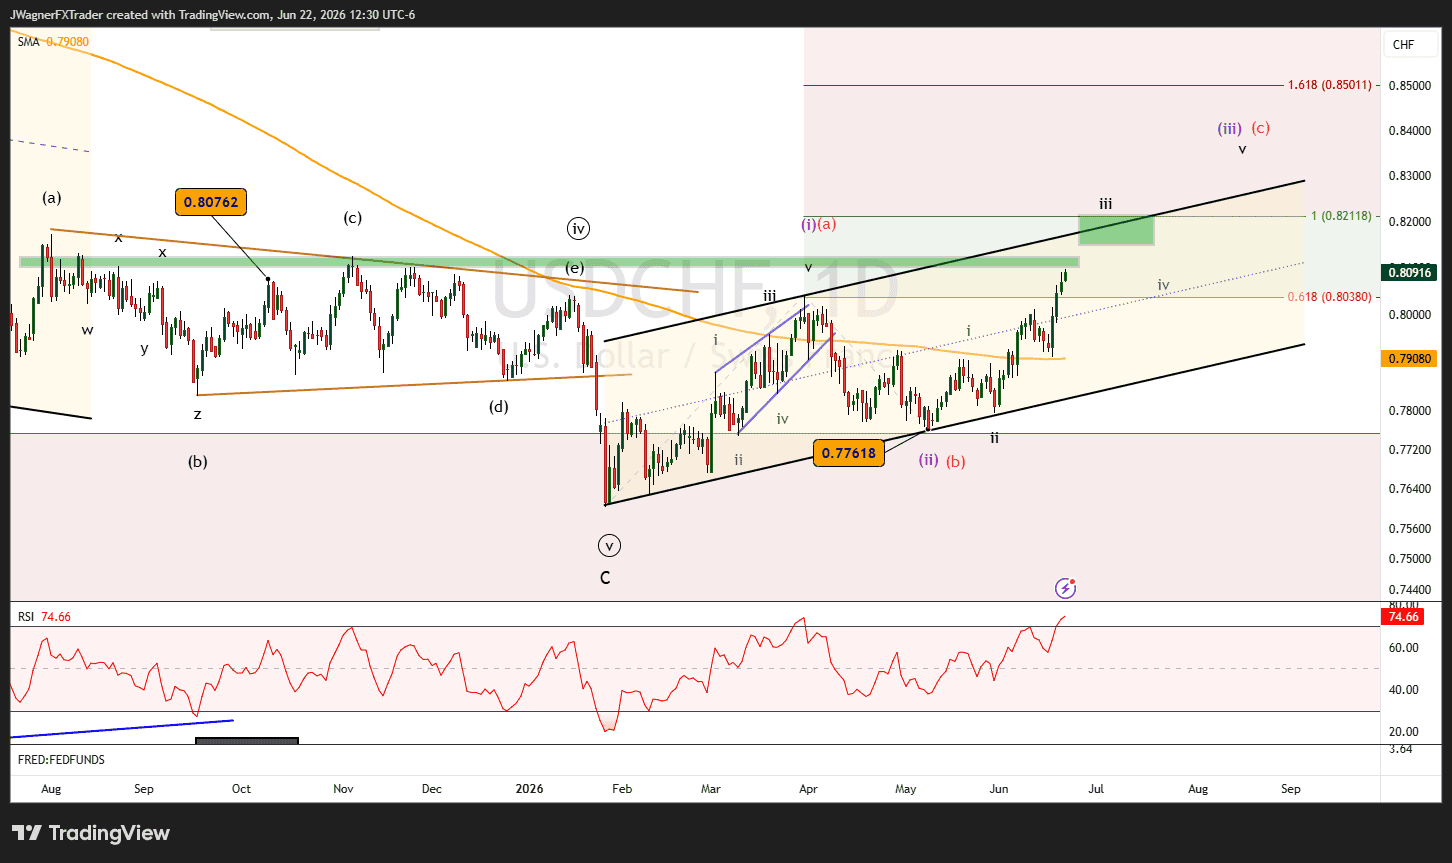
The Elliott wave analysis for the USD/CHF daily chart illustrates the middle of a 3rd leg higher from the 2026 low.
The rally from January 27 low is considered to be an impulse (purple labels) or zigzag (red labels).
Regardless, we are anticipating 5-waves higher from the May 8 low of .7761 labeled i-ii-iii-iv-v.
It appears USD/CHF is currently in the middle of wave iii. We suspect this wave may rally to meet the upper portion of the parallel price channel near .8212.
From there, a sideways consolidation may build for wave iv, while USD/CHF prices hold above .7907.
Then, another blast higher in wave v to finalize the rally from .7761.
For the next several weeks, we suspect USD/CHF will hold comfortably above the 200-day simple moving average.
Signs of a medium-term top would appear if we begin to see bearish RSI divergence.
In the event that USDCHF prices push below the 200-day simple moving average, then we’ll need to reassess the wave count including the possibility that red wave © topped.
Bottom line
USD/CHF is likely running higher in a 3rd wave rally. We suspect this rally may carry up to .8212 to finalize the wave (iii).
If USD/CHF begins to fall below the 200 day SMA, then we’ll consider alternative wave counts including red wave (c) has already topped.
Author

Zorrays Junaid
Alchemy Markets
Zorrays Junaid has extensive combined experience in the financial markets as a portfolio manager and trading coach. More recently, he is an Analyst with Alchemy Markets, and has contributed to DailyFX and Elliott Wave Forecast in the past.