The flow of Gold from West to East in one picture

I’ve written quite a bit about the movement of gold from the East to the West.
Here’s the story in one picture:
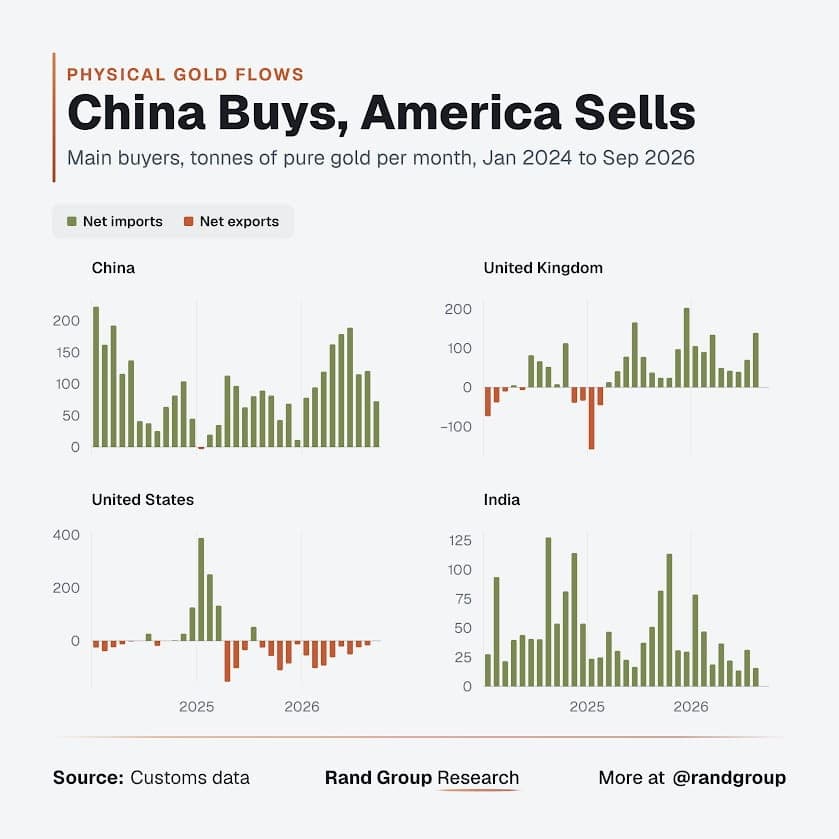
The picture needs no explanation.
Over the last couple of years, Hong Kong and Singapore have built out infrastructure to support the growing gold trade. Last summer, Hong Kong launched a gold settlement system, hoping to challenge Western dominance of the gold trade. And just this week, the Monetary Authority of Singapore announced plans for a vaulting service to hold bullion for foreign central banks.
As you can see from global gold flows, these efforts seem to be paying off.
We also see it playing out in gold demand data. Asian and Indian investors continue to buy gold, even as Westerners, particularly Americans, sell.
Chinese bar and coin demand rose 7 percent year-on-year in Q3 to 79 tonnes. Year-to-date demand of 393 tonnes ranks as the highest on record, 11 percent above the 2013 high.
Chinese physical gold demand is even more impressive in value terms. Year-to-date spending of $59 billion already exceeds every full year in the World Gold Council data series. Q3 demand alone surged by 32 percent to 11 billion.
Indian demand has been muted due to government efforts to limit imports, including a significant increase in import duty. However, demand picked up early in the fall festival season despite the higher price.
Meanwhile, U.S. bar and coin demand fell 40 percent year-on-year to 8 tonnes. It was the weakest quarter for coin and bar demand since Q4’19.
This isn’t anything new. Even during last year’s spectacular gold bull market, American investors generally stayed on the sidelines until late in the year. Physical gold investment surged in 2025, with coin and bar demand hitting a 12-year high of 1,374.1 tonnes. More than half of the global coin and bar demand came from two countries – China and India.
The split between East and West becomes even starker when looking at the data for the first half of last year.
Chinese bar and coin demand grew by 44 percent year-on-year in H1 last year as investors snapped up 115 tonnes of gold bars and coins in the second quarter alone. It was the strongest H1 for physical gold buying since 2013.
Meanwhile, Americans continued selling. Year-on-year bar and coin sales plummeted by 53 percent in H1. Second-quarter demand was only 9 tonnes, the lowest quarterly level since Q4 2019.
You can see this phenomenon play out in daily trading data.
During Asian trading hours, gold was up 12.9 percent through the first six months of the year. During North American trading hours, the yellow metal was down 15 percent. European sessions split the difference, with gold falling modestly by 1.3 percent.
The World Gold Council called Asia “the engine of price support.”
"Interestingly, intraday analysis suggests that the bulk of gold’s movements have been linked to activity during Asian and U.S. trading hours. Many of the pullbacks occurred during US hours and, conversely, gold’s rebounds generally occurred during Asian hours."
It will be interesting to see what happens when Western investors figure out what the Asians see in gold.
To receive free commentary and analysis on the gold and silver markets, click here to be added to the Money Metals news service.
Author

Mike Maharrey
Money Metals Exchange
Mike Maharrey is a journalist and market analyst for MoneyMetals.com with over a decade of experience in precious metals. He holds a BS in accounting from the University of Kentucky and a BA in journalism from the University of South Florida.