The big guy's trap on EUR/USD — Step by step [Video]
![The big guy's trap on EUR/USD — Step by step [Video]](https://editorial.fxsstatic.com/images/i/eur-usd-fix-02.jpg)
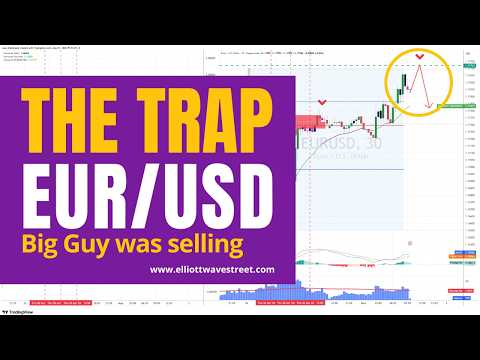
Friday morning, New York session. EUR/USD was climbing and everyone was buying. The news was positive, sentiment was bullish, and traders were piling in like sheep following the one in front of them. Meanwhile, the Big Guy was selling every contract they wanted to buy. We posted the chart in our Discord before the trap closed.
If you watched the video, you already know the story. Here I'm going to give you what the video didn't cover: the exact levels of the process, the opposite scenario that invalidates the trap, and a condition you need to watch this week.
What the video shows: Anatomy of a liquidity trap
The mechanics are straightforward once you see them. Price rises to a level where the stops from short sellers get triggered — in this case, the previous high at 1.1753. The sellers are out. The Big Guy collects his profits from those stops. So far, business as usual.
But now the Big Guy has a problem: the buyers are winning. If price keeps going up, they profit — and that's money coming out of institutional pockets. So the Big Guy does the only thing he can: he absorbs them. He delivers all the liquidity they want. You want to buy? Here you go. Want more? Take it. Because every contract you buy, he's selling to you.
On the Volwaves indicator, this reads with absolute clarity. While price makes new highs, the institutional volume line drops. The Big Guy's line positions itself below the price line. He's pulling liquidity from the bid and accumulating shorts. On Friday, the divergence was so clean we posted the chart before price turned.
What the video didn't cover: That volume bar doesn't mean what you think
Here's the reframe I want you to walk away with.
When you see a high volume bar at a liquidity zone, your instinct says "confirmation." High volume at a resistance that breaks — signal of strength, right? Wrong. That same bar carries a completely opposite meaning depending on who is responsible for the volume.
If the high volume belongs to retail buyers being absorbed by the Big Guy who's selling, that bar is a trap signal. If the high volume belongs to the Big Guy buying while retail sells, that bar is genuine accumulation. The bar looks identical. The direction that follows is opposite.
Without Volwaves, you have no way to distinguish one from the other. That turns every liquidity zone into a coin flip. With Volwaves, the answer is on the chart before price turns.
For the technical reader: The distinction is measured by the direction of the institutional volume line relative to the price line. When they diverge — price rising, volume falling — the Big Guy is on the opposite side of the retail trade. When they converge, he's accompanying the move.
The entry: Where, when, and at what risk
The setup was clean. Once price reached the new high and the indicator confirmed the Big Guy was selling, we waited for price action to deliver the trigger: the first 30-minute candle to close below the high of the previous candle.
- Entry: 1.1767
- Stop loss: 1.1787 (swing high — 20 pips of risk)
- First target: 1.1720 (stop cluster from traders who bought during the bullish leg)
- Final result: Price reached 1.1689
The reward-to-risk ratio ended above 3:1 on a 20-pip stop. That's the kind of asymmetry you get when you know which side the Big Guy is on before you enter.
The opposite scenario: When the trap isn't a trap
The video showed a counter-example and I want to expand on it here because it's as important as the trade itself.
At the 1.1720 low, price reached another liquidity zone. Volume bars were high. Price action showed rejection. Everything looked like a reversal to the upside — visually identical to the setup at the high.
But institutional volume told a different story. The line kept falling. The Big Guy wasn't buying at that low — he was taking profits from stops and continuing distribution. Volume was amplifying to the downside, not contracting. After the pullback, price continued falling.
The rule is this: if at the liquidity zone institutional volume diverges from price, there's a trap and there's a trade. If it converges with price, there's no trap — the Big Guy is accompanying the move and you stay out.
This distinction is the difference between trading with data and trading with hope.
What to watch this week
EUR/USD closed the week with the Big Guy in a short position. As long as that condition holds on Volwaves, rallies are selling opportunities — not reversal signals.
The key level is 1.1720. If price retests that zone and institutional volume remains bearish, there's continuation. If the Big Guy starts buying at that level, the dynamic changes. In the next installment, I'll show you exactly what that transition looks like on the indicator — because the moment the Big Guy switches sides is where the next major move is born.
Author

Juan Maldonado
Elliott Wave Street
Juan Maldonado has a University degree in Finance, and Foreign trade started his trading career in 2008. Since 2010 has been analyzing the markets using Elliott Wave with different strategies to spot high probability trades.


