Mixed bias – A mixed day
USD: Sep '26 is Down at 100.825.
Energies: Aug '26 Crude is Down at 67.46.
Financials: The Sep '26 30 Year T-Bond is Lower by 8 ticks and trading at 112.13.
Indices: The Jun '26 S&P 500 emini ES contract is 10 ticks Lower and trading at 7541.00
Gold: The Aug'26 Gold contract is trading Down at 4076.60.
Initial conclusion
This is not a correlated market. The USD is Down and Crude is Down which is not normal, but the 30-Year T-Bond is trading Lower. The Financials should always correlate with the US dollar such that if the dollar is Higher, then the bonds should follow and vice-versa. The S&P is Lower and Crude is trading Lower which is not correlated. Gold is trading Lower which is not correlated with the US dollar trading Down. I tend to believe that Gold has an inverse relationship with the US Dollar as when the US Dollar is down, Gold tends to rise in value and vice-versa. Think of it as a seesaw, when one goes Up the other goes Down. Asia traded Mixed All of Europe is trading Higher.
Possible challenges to traders
- FOMC Member Daly Speaks at 7:45 AM EST. Major.
- Average Hourly Earnings m/m is out at 8:30 AM EST. Major.
- Non-Farm Employment Change is out at 8:30 AM EST. Major.
- Unemployment Rate is out at 8:30 AM EST. Major.
- Unemployment Claims is out at 8:30 AM EST. Major.
- Factory Orders is out at 10 AM EST. Major.
- Natural Gas Storage is out at 10:30 AM EST. Major.
Traders, please note that we've changed the Bond instrument from the 10 Year (ZN) to the 2 Year (ZT). They work exactly the same.
We've elected to switch gears a bit and show correlation between the 2-year Treasury notes (ZT) and the S&P futures contract. The YM contract is the Dow Jones Industrial Average, and the purpose is to show reverse correlation between the two instruments. Remember it's likened to a seesaw, when up goes up the other should go down and vice versa.
Yesterday the ZT climbed Higher at around 8:30 AM EST with various news items released. The Dow dived Lower at around the same time. Look at the charts below and you'll see a pattern for both assets. The ZT climbed Higher at around 8:30 AM EST and the Dow dived Lower around the same time. These charts represent the newest version of Bar Charts, and I've changed the timeframe to a 15-minute chart to display better. This represented a Long opportunity on the 2-year note, as a trader you could have netted 20 plus ticks per contract on this trade. Each tick is worth $6.25. Please note: the front month for the ZT is now Sep '26. I've changed the format to filled Candlesticks (not hollow) such that it may be more apparent and visible.
Charts courtesy of BarCharts
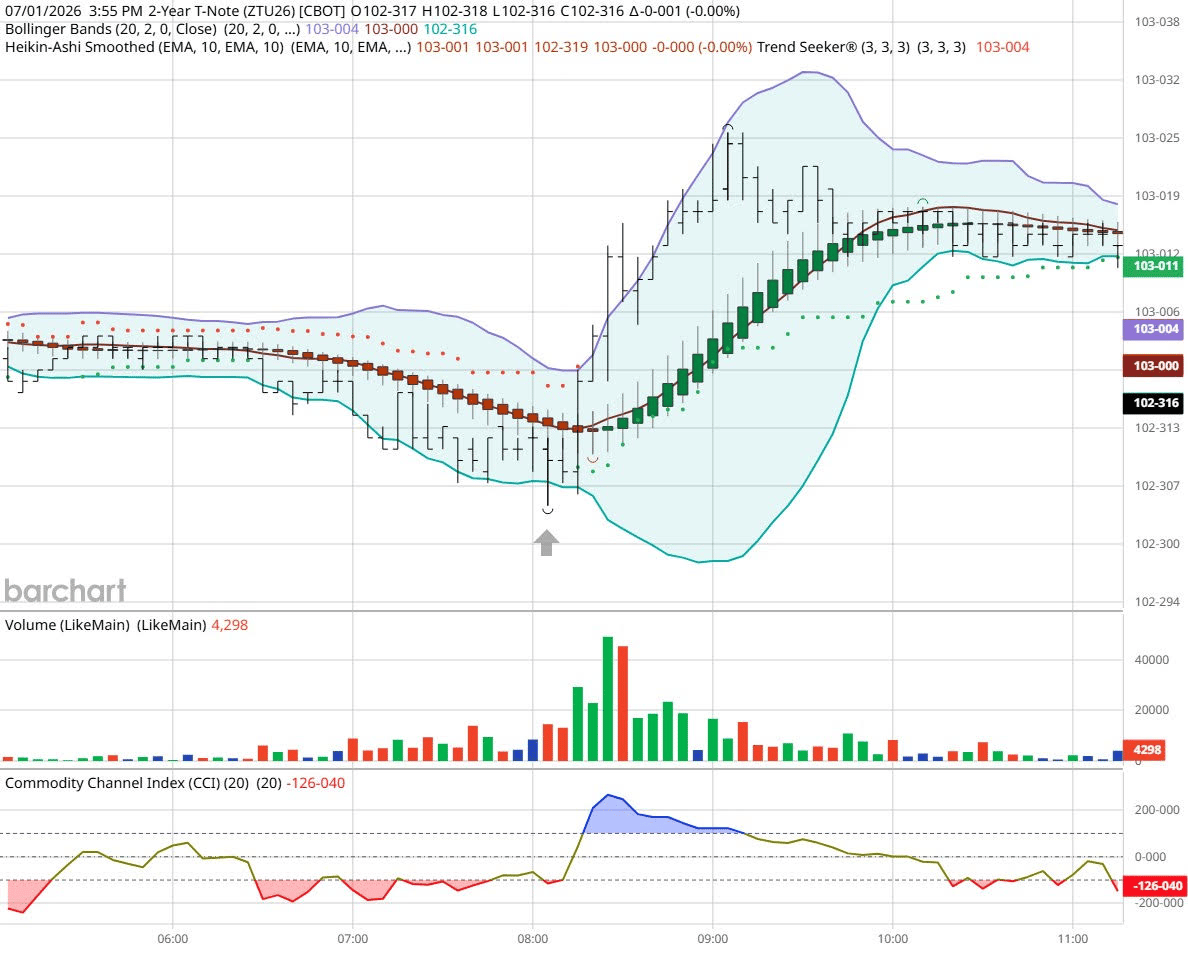
ZT -Sep 26 - 7/01/26
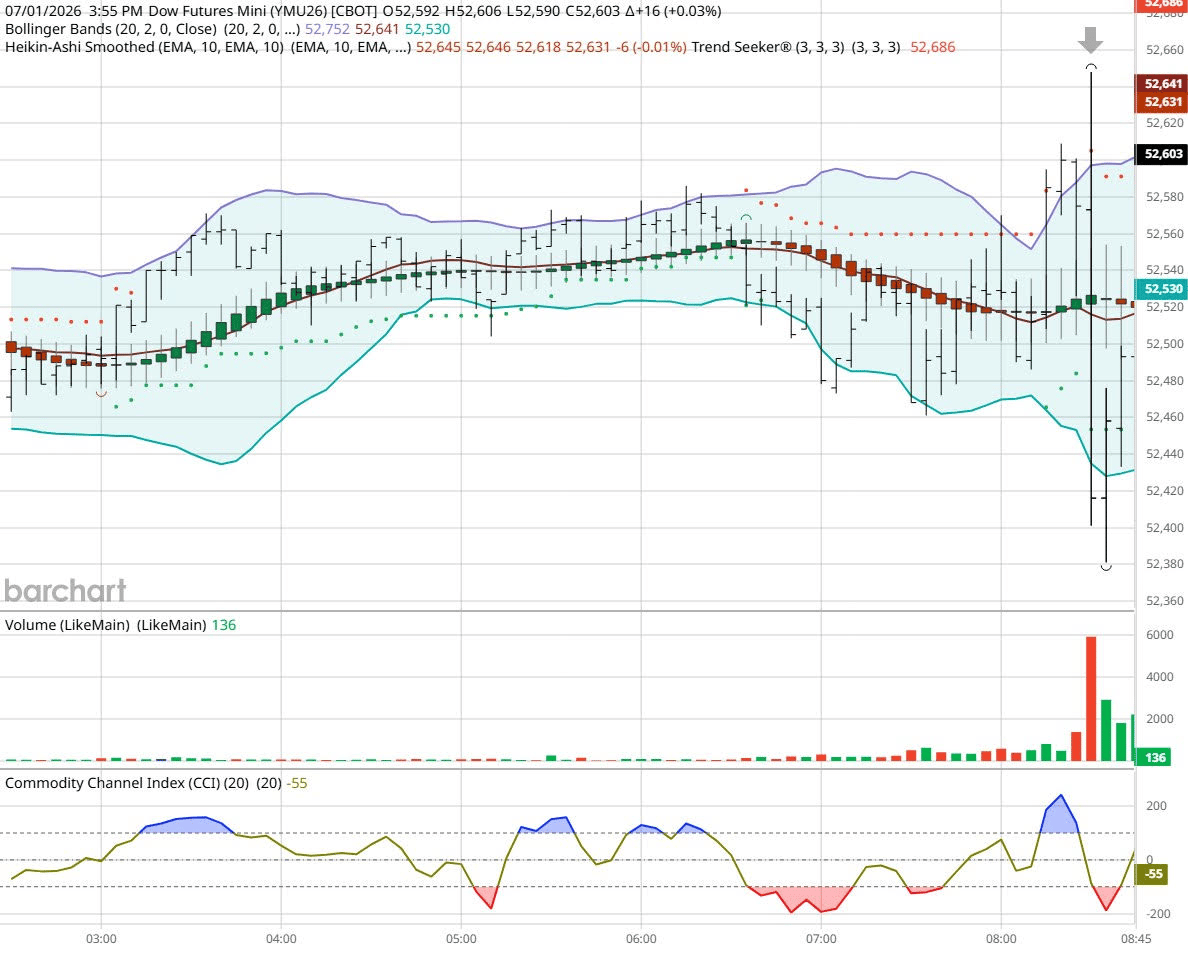
Dow - Jun 2026- 7/01/26
Bias
Yesterday we gave the markets a Mixed or Neutral bias and the markets didn't disappoint as Dow and S&P gained but the Nasdaq closed Lower. All-in-all a Mixed Day. Today we have the June job numbers out at 8:30 AM EST as Friday is the fourth of July celebrated and tomorrow we have an abbreviated session that will end early. As such our bias will remain Neutral or Mixed.
Could this change? Of Course. Remember anything can happen in a volatile market.
Commentary
The markets as of late are very confused between the situation is Iran and the affordability concerns. It seems that each trading day someone is breaking the Iran MOU agreement so time will tell how this all works out. Want to learn Market Correlation and determine market direction hours before the Opening Bell?
Author

Nick Mastrandrea
Market Tea Leaves
Nick Mastrandrea over 20 years experience in trading and formerly held a NASD Series 7. He currently holds a NJ Life, Health and Variable Authority. Nick is a published writer and his work has appeared in Futures Magazine, TraderPlanet and others.