JPMorgan sees Iran oil system hitting shut in threshold within 15 days
Shut In threshold within 15 days
With the war grinding into its third month, the market has quietly shelved the old “will it reopen” debate. That trade is dead. Any notion of a prompt restart has evaporated, and across the Gulf, production is no longer flowing freely but being methodically choked, well by well. Shut-ins are spreading through the system, and even in the best case, bringing that capacity back online is not a flick of a switch but a slow mechanical resurrection that will take months, if not longer, to resemble anything close to pre-war normality.
Which brings the market to the more uncomfortable question now sitting on every energy desk. Iran, having long wielded disruption as leverage against its neighbours, is now staring into the same mirror. With a blockade tightening around its own exports, how long before Tehran is forced into its own round of shutdowns, and what does that mean when the pressure builds inside reservoirs that were never meant to sit idle?
That is the scenario Natasha Kaneva, head of commodities at JPMorgan, set out to map. Her framework does not treat this as a binary headline risk but as a slow-burning constraint, where the longer flows remain restricted, the greater the risk that Iran’s production system itself becomes the next casualty of the conflict.
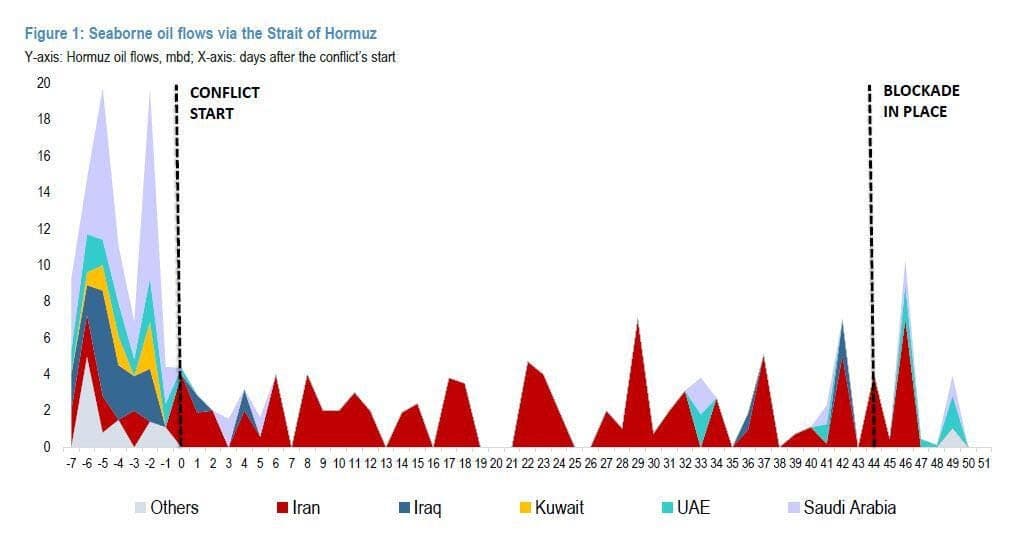
But first, some background. Saturday saw the busiest tape through the Strait of Hormuz since the conflict began. After Iran briefly reopened the chokepoint on Friday, more than 20 vessels slipped through, largely smaller product tankers with no obvious Iranian linkage. By Sunday, the window slammed shut again. Tehran reimposed restrictions and reportedly fired on transiting ships, arguing the ongoing US naval blockade constitutes an act of war and breaches the Pakistan-brokered ceasefire framework. The result was a near collapse in flows, with crossings falling to roughly 4 percent of normal levels, the weakest print of April, and traffic reduced mainly to Iran-aligned cargo.
Even so, the real-time picture is more nuanced than the official rhetoric suggests. While government statements point to severe disruption, data from Lloyd’s List Intelligence indicates that shadow fleet movements continue to thread the needle. At least 26 Iranian-linked vessels are said to have navigated around the blockade, though US officials have pushed back on those claims.
Taken together, the US interdiction effort, including the boarding of two Iran-associated ships, looks less like a full stop and more like a tightening choke collar around Iran’s shipping lanes. Flows are constrained, not eliminated. But for the market, the distinction barely matters. What is hitting the tape is a sharp drop in effective supply, with less than half of Iran’s March export run rate, around 0.8 mbd, making it to global markets, supplemented only marginally by volumes rerouted through bypass pipelines.
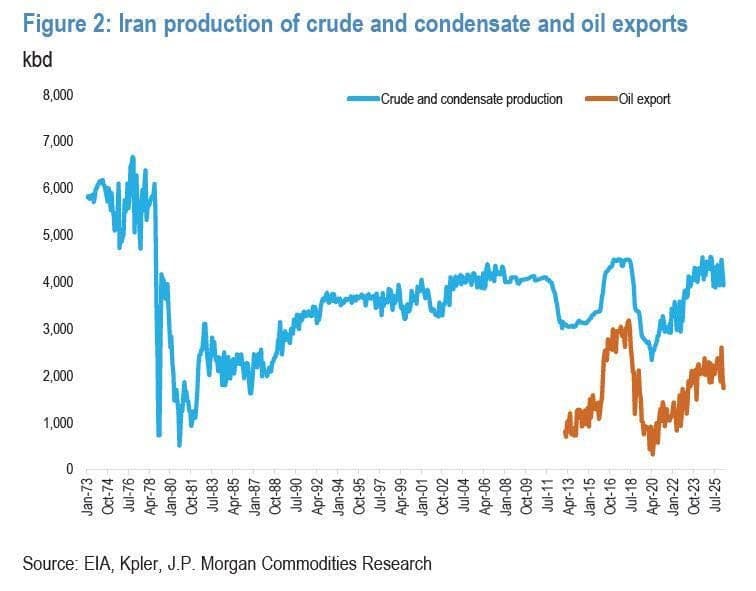
Taking a step back, Iran came into 2026 already leaning against the ropes. Sanctions had tightened, trade channels were narrowing, and growth was feeling the squeeze well before any talk of a full blockade entered the frame. Even after the US withdrawal from the Iran nuclear deal in 2018, exports never truly flatlined. Barrels found a way out through rerouted cargoes and gray market networks, a shadow system that kept volumes breathing even under pressure.
But a physical blockade is a different animal entirely. It does not just tax flows, it pins them down. Where sanctions work through price and access, a hard interdiction works through physics. Ships do not sail, cargo does not clear, and the usual workaround trade begins to fracture under the weight of enforcement.
That distinction is now central to the market’s thinking. If fully sustained, a blockade does not just slow Iran’s exports, it mechanically caps them, shrinking the escape routes that once kept volumes alive. And over time, that pressure feeds back into the reservoir itself, forcing production cuts not by choice, but by necessity.
In that sense, the script is flipping. The same shut in dynamic that Iran once imposed on its neighbors is now circling back toward its own fields, turning a tool of leverage into a constraint that threatens to bite at the core of its production system. ,,
At the same time, the barrels that do slip through the net, combined with cargoes already in transit outside the Gulf, and the windfall captured in the early phase of the conflict, when Iranian crude was still clearing at elevated prices while regional competitors pulled back, provide a short term financial buffer. In market terms, Iran monetized the chaos early. That cushion buys time. It also creates a narrow lane of negotiating leverage, but only if the blockade is not just symbolic, rather enforced with consistency and stretched over months, not weeks. Anything less, and the pressure dissipates before it compounds.
Before getting to the core of the problem, one qualifier matters. Even under a sanctions backed squeeze, the system is not designed to fully sever humanitarian lifelines. Guidance from Office of Foreign Assets Control makes clear that trade in agricultural goods, food staples, medicines, and medical devices is broadly permitted.
So the endgame here is not a total economic blackout. It is something more insidious from a market perspective. A grinding scarcity, rising friction in logistics, and a steady impairment of flows without a complete shutdown of essential imports. Iran continues to receive critical goods, but the arteries of trade narrow, thicken, and slow, turning what was once a functioning export system into something far more constrained and unpredictable.
With that framing in place, the lens from JPMorgan sharpens the narrative. Here are the key highlights from their work, distilled through a market lens:
Ionshore storage sits around 86 million barrels, currently just over half full at roughly 47 mb. That leaves about 40 mb of working capacity, which, in market terms, translates into roughly 22 days of export cover if flows are fully choked off. Layer in the four Iran linked VLCCs still sitting inside the Strait of Hormuz, and you add another 8 mb of potential floating relief, stretching that window toward 26 days.
But the system does not wait for tanks to hit the brim before reacting. Production does not fall off a cliff, it bends under pressure. In practice, upstream adjustments begin earlier and build progressively. The rule of thumb embedded in the JPM framework is that Iran would need to start trimming output after roughly 16 days of a full export blackout, with curtailments accelerating from there until they converge toward full export volume shut ins, around 1.9 mbd, closer to day 30.
Translated into market time, the clock is already ticking. If a de facto export blackout began this weekend, Iran would be staring at roughly a two-week runway before the first production cuts are forced through the system, with the full shut-in process needing to be completed by around day 30, placing the real inflection somewhere in the back half of May.
There is, however, a floor beneath the fall. Iran is a net exporter, but it cannot starve its own system. Domestic demand is near 1.8 mbd, effectively setting a minimum operating threshold for upstream production even under prolonged disruption. History reinforces that constraint. Since 1973, Iranian crude output has rarely dipped below that level, with the notable exception of the upheaval during the Iranian Revolution.
So the market is not just watching exports anymore. It is watching the storage clock, the production glide path, and the point where a flow problem becomes a reservoir problem. That is where the real pricing power begins to shift.
The economic hit, however, is not subtle; it is surgical. Strip away roughly 2 mbd of exports, and you are not just trimming revenue, you are cutting directly into the core artery of the Iranian economy. Based on estimates drawn from market and policy data, that kind of disruption amounts to a loss of about $150 million per day under current pricing conditions, a steady bleed that compounds with each passing session.
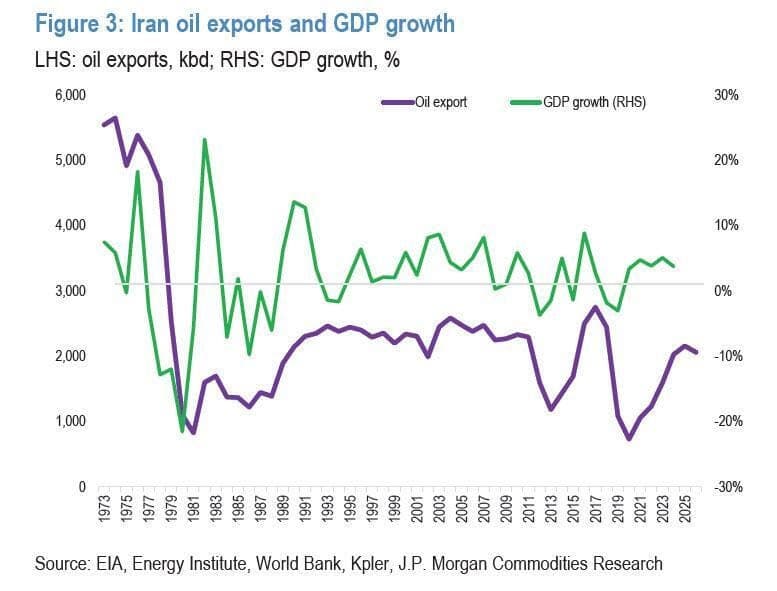
And the reason the impact bites so deeply is structural. Oil and gas are not just exports for Iran; they are the export machine. According to macro data, hydrocarbons account for roughly 80% plus of total export revenues, making the country exceptionally exposed to any disruption in physical flows.
In market terms, this is not a cyclical drawdown, it is a forced deleveraging of the entire external account. When the barrels stop, the dollars stop. And when the dollars stop, everything downstream, fiscal spending, currency stability, domestic liquidity, begins to tighten in tandem.
So while the blockade operates at sea, the real pressure transmits onshore. Not through headlines, but through the slow suffocation of the revenue stream that keeps the system turning.
Still, the system is not completely stranded. Iran has barrels already in motion, and in this market, anything afloat is still monetizable. Data from Kpler suggests roughly 176 million barrels of Iranian crude are currently on the water, with about 142 million already beyond the Arab and Omani Gulf corridors and therefore outside the immediate chokehold of a Strait-focused blockade.
That matters because once cargo clears the Strait of Hormuz, enforcement becomes exponentially more complex. Policing a narrow maritime bottleneck is one thing. Chasing vessels across the Indian Ocean and into Asian discharge points is something else entirely. The US Navy has shown it can interdict Iranian-linked shipments well beyond the Gulf, but doing so consistently is a far more diffuse and operationally demanding exercise.
Tehran, for its part, is unlikely to sit still. The playbook will evolve in real time. Expect a renewed push through third-country logistics, creative cargo blending, and the continued use of shadow networks, including China-flagged tankers, to keep barrels moving under the radar. The system bends before it breaks.
There is also less vulnerability on the import side than in prior cycles. Iran’s dependence on gasoline imports has structurally declined since the pre 2018 period, when reliance ran close to 100 kbd. That shift reduces one of the traditional pressure points, allowing the domestic system to absorb more of the external shock without immediately buckling.
So while the blockade tightens the export valve, it does not seal the system shut. Not yet. What it does instead is fragment the flow, forcing Iran into a more complex, slower, and less efficient trading network, where every marginal barrel becomes harder to move, and every transaction carries a higher cost.
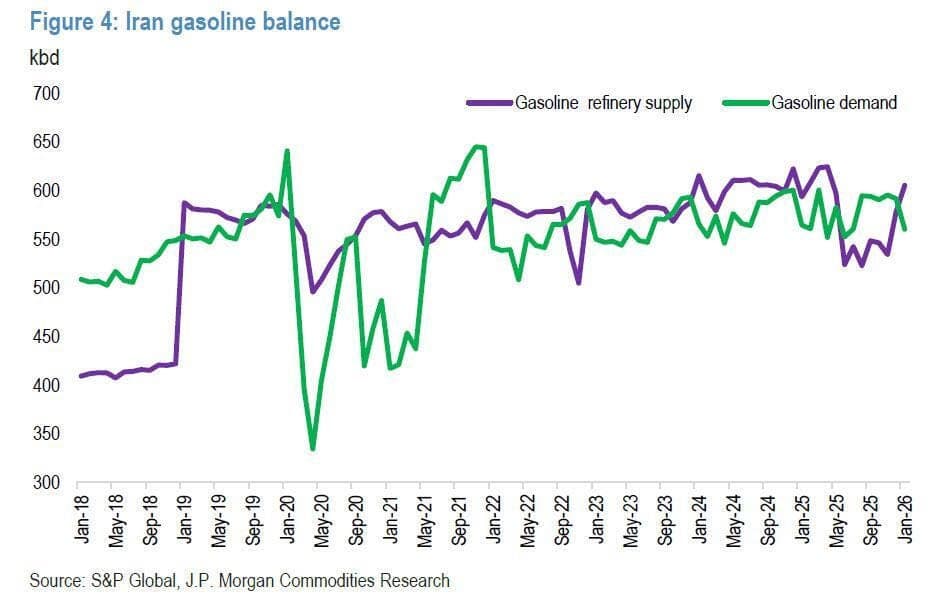
The structural shift that reshaped Iran’s vulnerability profile began with the commissioning of the Persian Gulf Star refinery in April 2017. What followed was not just a capacity build, but a strategic pivot. By early 2019, the ramp up was largely complete, transforming Iran into a largely self sufficient gasoline producer and establishing the complex as the world’s largest gas condensate refinery. By 2025, import requirements had dwindled to roughly 8 kbd, a rounding error compared to prior dependency.
That insulation was tested. When Israel struck the South Pars gas field, the primary condensate feedstock source for Persian Gulf Star, gasoline shortages surfaced through the summer. But the system proved resilient. As upstream operations normalized, feedstock flows recovered, refinery runs stabilized, and by year end domestic supply was once again aligned with demand. The key takeaway is simple. Iran has hardened one flank of its energy system even as another is now under siege.
That does not mean the pressure cannot spread. The conflict is already probing for new fault lines. Reports via Iranian state media suggest Houthi forces in Yemen have been placed on high alert, pulling the Bab el Mandeb into sharper focus as a potential second theatre. If Hormuz is the choke collar, Bab el Mandeb is the pressure valve. Any escalation there risks widening the conflict horizontally and extending the energy shock across multiple arteries of global trade.
Step back, and the counterfactual becomes instructive. Had the Trump administration moved to enforce a full oil blockade when first floated in mid March, the market would likely already be staring at a complete shut in of Iranian production. That, in turn, would have crushed the current account, stripped export revenues to the bone, and steadily eroded Tehran’s leverage as idle tankers rerouted toward alternative supply hubs, most notably the United States, whose shale complex has quietly emerged as one of the primary beneficiaries of this dislocation.
But the real question sits deeper than flows and freight. It is about the integrity of the system itself. A full shut in is not a pause, it is a potential breaking point. Iran’s upstream infrastructure is aging, and prolonged inactivity risks permanent damage to reservoirs and production facilities, turning what should be a cyclical restart into something far more uncertain, if not structurally impaired.
That is the decision tree the market is now waiting to see unfold. How Iran responds when faced with the prospect of a total shutdown, and whether that pressure forces a shift in negotiating posture before the system crosses a point of no easy return.
As it stands, the clock is running. The storage buffer, the export constraints, and the production glide path all converge on a narrow window. Roughly 25 days. That is how long the market has before this moves from a question of flows to a question of consequences.
Author

Stephen Innes
SPI Asset Management
With more than 25 years of experience, Stephen has a deep-seated knowledge of G10 and Asian currency markets as well as precious metal and oil markets.


