Is the US Natural Gas undervalued?


In this article I will talk about the U.S. benchmark natural gas futures contract traded on NYMEX (Henry Hub Natural Gas; CME Globex code: NG) and will attempt to objectively answer a straightforward question: ‘is the U.S. natural gas currently undervalued?’. I will conclude with my market outlook and whether I am currently buying or selling.
Current price context
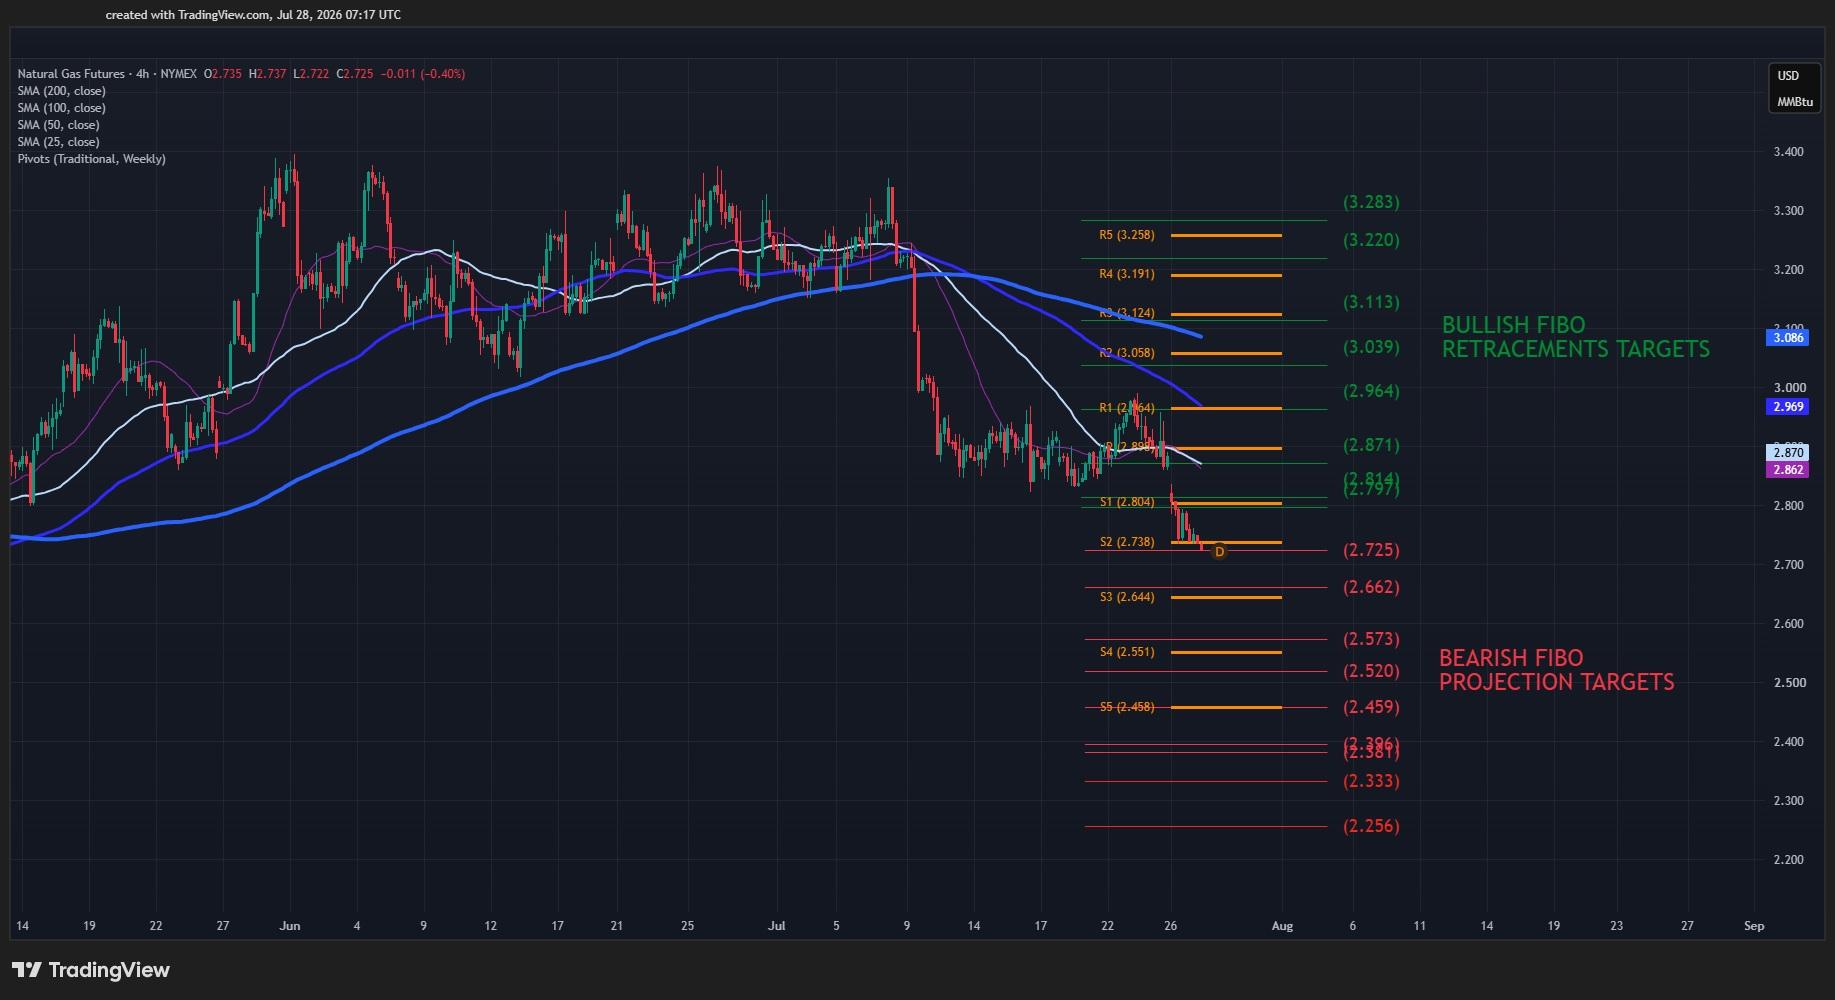
The U.S. natural gas front-month futures contract (NGQ26) settled at $2.767 per Million British thermal units (MMBtu) on 27 July 2026, down 3.62% on the day. On the continuation chart, natural gas lost more than 16% in value this month and is down almost 20% since 1 June. It currently sits at 11-week low, below all key daily moving averages.
The current price is also well below both the prior-year average of $3.621 and the running five-year average price of $3.818. Furthermore, a substantial disconnect exists between natural gas pricing at Henry Hub and global benchmarks, such as Title Transfer Facility (TTF) in Europe and Japan Korea Marker (JKM) in Asia. Although this disparity is partly the result of major structural differences in supply access, it is still quite substantial. Yesterday, TTF settled at $19.398 per MMBtu, while JKM settled at $21.43 per MMBtu, 601% and 674% above Henry Hub benchmark, respectively.
Because the United States is a self-sufficient net exporter of natural gas and has vast reserves, Henry Hub prices tend to be driven primarily by domestic factors. Global conditions play a relatively minor role. Therefore, whether U.S. natural gas is ‘undervalued’ or not depends on how we weigh domestic natural gas balance situation against growing demand tailwinds and geopolitical risk premiums.
Global Natural Gas prices

Bearish factors
Let’s talk about the factors, which may explain why U.S. natural gas may be fairly priced or even overvalued.
- Record dry gas production. U.S. natural gas output has been trending higher lately. In fact, it is estimated that it almost reached an all-time high on 27 July, approximately 112.0 billion cubic feet per day (Bcf/d). Rising production naturally exerts a downward pressure on prices.
- Ample storage. Last Thursday, the U.S. Energy Information Administration (EIA) reported a 32 Bcf injection into natural gas storage for the week ending July 17. This brought total underground storage to 3,056 Bcf, 183 Bcf above the five-year average. In fact, according to Bluegold Trader, weekly injections this season have outpaced the five-year average by roughly 11 Bcf per week.
- Bearish positioning. According to Commodity Futures Trading Commission’s (CFTC) Commitments of Traders (COT) report, large speculators (leveraged funds and money managers) increased their short positions in natural gas futures and options (NYMEX and ICE combined) by 17,430 contracts for the week ending July 21. They currently hold 53,227 net-short contracts, the largest net-short exposure since March 2024.
- Reduced export flows. Due to protracted maintenance at Freeport export terminal, liquefied natural gas (LNG) exports have been subdued lately. Bluegold Trader estimates that flows to U.S. LNG export plants eased to 17.2 bcf/d in July (down from the 18.8 bcf/d record established in April, 2026).
Bullish factors
Now let’s talk about the factors, which may explain why U.S. natural gas may be undervalued.
- Strong summer demand. National Oceanic and Atmospheric Administration (NOAA) continues to forecast above normal temperatures across the U.S. through 12 August, meaning that the demand for cooling should remain strong, pushing electricity consumption higher. About 40% of US power generation comes from gas-fired plants, and aggregate natural demand is projected to rise from 87.4 Bcf/d this week to 89.0 Bcf/d next week.
- Geopolitical risk premium. The crisis in the Persian Gulf has disrupted Qatari LNG exports, which make it more likely that structural demand for U.S. exports will remain elevated for the foreseeable future.
- Structural demand growth. The long-term demand outlook is predominantly bullish, driven by substantial data centre power needs and electrification.
- Technically oversold. The front-month contract has entered technically oversold territory for the first time in three months. At the time of writing, Relative Strength Index (RSI) on a daily continuation chart stood at just 32.92, the lowest since 24 April.
My view
Natural gas front-month futures contract has already reached a 50% Fibonacci projection target of the decline which commenced on July 8. A further decline will require a fresh bearish impulse – either production needs to rise even further or the weather forecast has to get cooler.
Personally, I am starting to buy the dips here and will be looking to increase my long exposure on clear reversal signals. I believe that U.S. natural gas is undervalued for two main reasons:
1. The recent decline was driven by a production increase, but it is nothing unusual. Historically, net supply (i.e., production minus net exports) tends to peak twice a year, during the seasonal demand surges in July and December. From now on, production is actually more likely to decline rather than to increase even further.
2. While storage level remains above the 5-year average, I expect the surplus to shrink. I project storage injections to average around 25 bcf over the next five weeks, some 4 bcf below the five-year average and some 3 bcf below last year’s rate. In fact, I expect annual storage deficit to expand to -55 bcf by the end of August. Also, it is important to note here that this year’s five-year average benchmark for storage actually represents a rather high bar because it excludes the bearish data from 2020 Covid year. If we compare the current storage level to the five-year average from 2025, the surplus looks relatively marginal.
Although I wouldn’t expect U.S. natural gas futures price to rise back above $3.000 per MMBtu (unless production drops sharply), I believe that betting on a continuing decline is risky. From here, a retracement towards $2.871 seems reasonable.
Natural Gas front-month futures contract four-hour chart
Author