Iran tensions, central banks keep Gold glued to $5,000
- Gold continues to hold an important psychological floor near $5,000 despite recent volatility and pullbacks.
- Multiple US allies refuse request to escort vessels through the Strait of Hormuz.
- Expectations for rate cuts by the Fed and other central banks have faded as the US‑Israeli conflict with Iran enters its third week and rising energy costs stoke inflation worries.
- Fed widely expected to keep interest rates unchanged at this week's policy meeting.
- Demand for bullion has stayed strong in China, with investors adding to gold ETFs every day since returning from the Lunar New Year break on Feb. 24.
- CME FedWatch has trimmed expectations for rate cuts, reducing upside momentum for gold.

Gold prices were little changed on Tuesday, supported by safe-haven buying amid geopolitical tensions from the Iran war, but gains were capped as markets awaited the U.S. Federal Reserve's policy decision. Spot gold fell 0.13% to $4,998.42 per ounce at 10:50 GMT.
Shining metal has climbed about 16% year-to-date as geopolitical uncertainty and worries over the Fed’s independence boost demand for safe havens. Momentum has eased since the war began on Feb. 28, but concerns about stagflation. Slower growth paired with high inflation supports gold’s long-term appeal as a store of value.
Although gold is often viewed as an inflation hedge, it can lag in high-rate environments because holding a non-yielding asset carries higher opportunity costs.
The U.S. Federal Reserve is widely expected to keep rates unchanged for a second straight meeting when it issues its policy statement on Wednesday, while markets also await post-conflict first meetings from the European Central Bank, Bank of England, and Bank of Japan.
Current Target Rate = 3.50 - 3.75
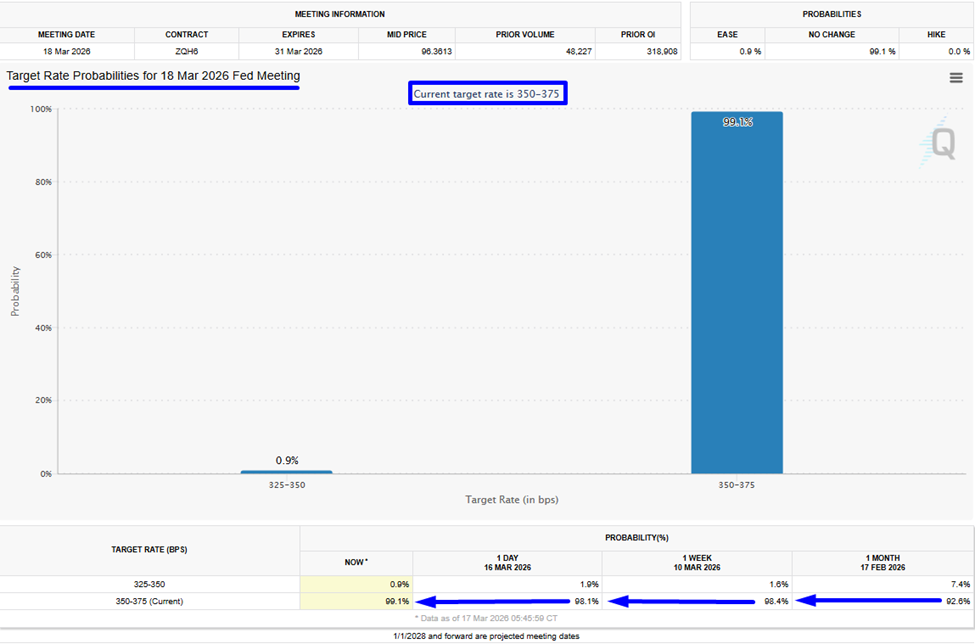
- CME FedWatch March no rate change probabilities have moved higher to 99.10% today from 92.6% on February 17, 2026.
Fed rate probability
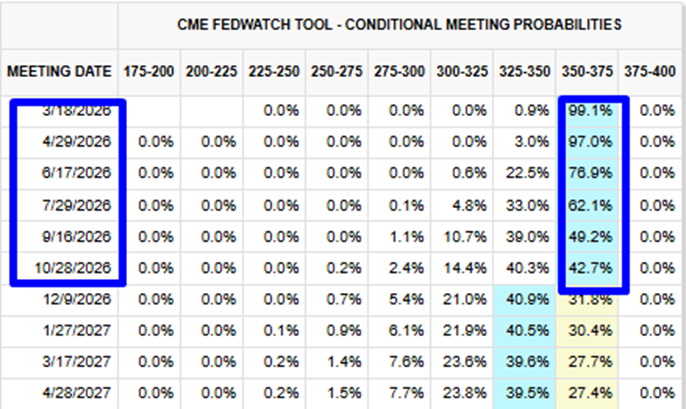
- CME FedWatch latest Fed rate probability points at no rate cut until November 2026. What a change!!!
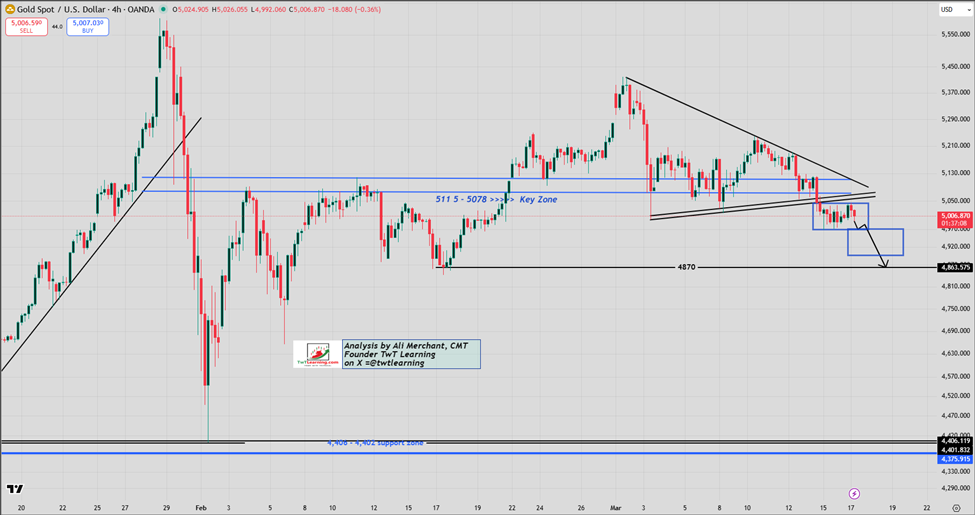
Gold/US Dollar:
- Spot gold was near $4,967 on March 15, slightly above $4,965 target mentioned in the prior report.
- Gold is trading inside a rectangle between $5,045 and $4,970.
- A decisive, sustained break under $4,970 would target $4,895, with further risk toward the mid‑February low around $4,870.
- Overall bias remains bearish for gold.
Gold 4 hourly chart:
Gold/Silver Ratio:
- The gold–silver ratio shows how many ounces of silver buy one ounce of gold (gold ÷ silver), a key measure of relative value.
- The ratio is trading in a 56–65 range, consistent with the past month and implying range-bound action for both metals.
- A rising ratio typically signals relative weakness in both metals.
Gold/Silver Ratio Monthly chart:
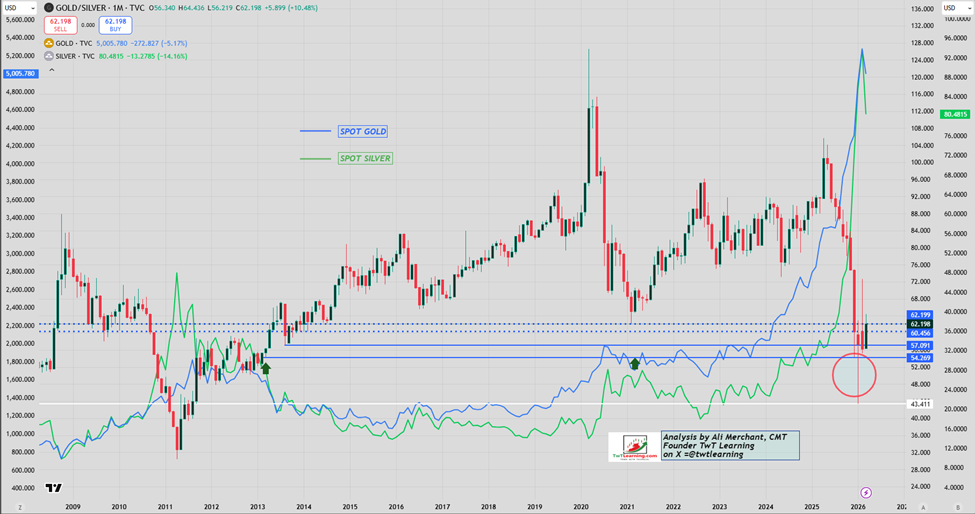
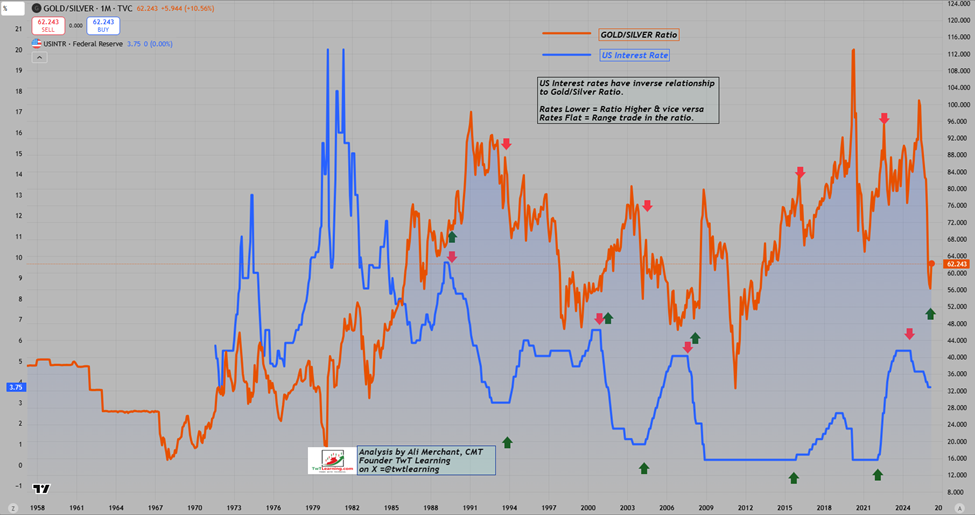
Gold/Silver Ratio vs US Interest Rate Monthly chart:
- US interest rates and the gold–silver ratio move inversely.
- Falling rates tend to push the ratio higher.
- Rising rates tend to push the ratio lower.
- Stable rates usually produce a range-bound ratio.
Author

Ali Merchant, CMT
TwT Learning
Ali Merchant is a seasoned financial market professional with expertise in Technical Analysis, Treasury & Capital Markets, Trading, Sales, Research, Training, & Fund Management, He has been trading FX, FX options, US stocks & opti